
Glycan 3D structures, analyzed at scale.
Hand it a sequence. It brings the conformers and returns contacts, surface accessibility, flexibility, torsions, and hydrogen bonds.


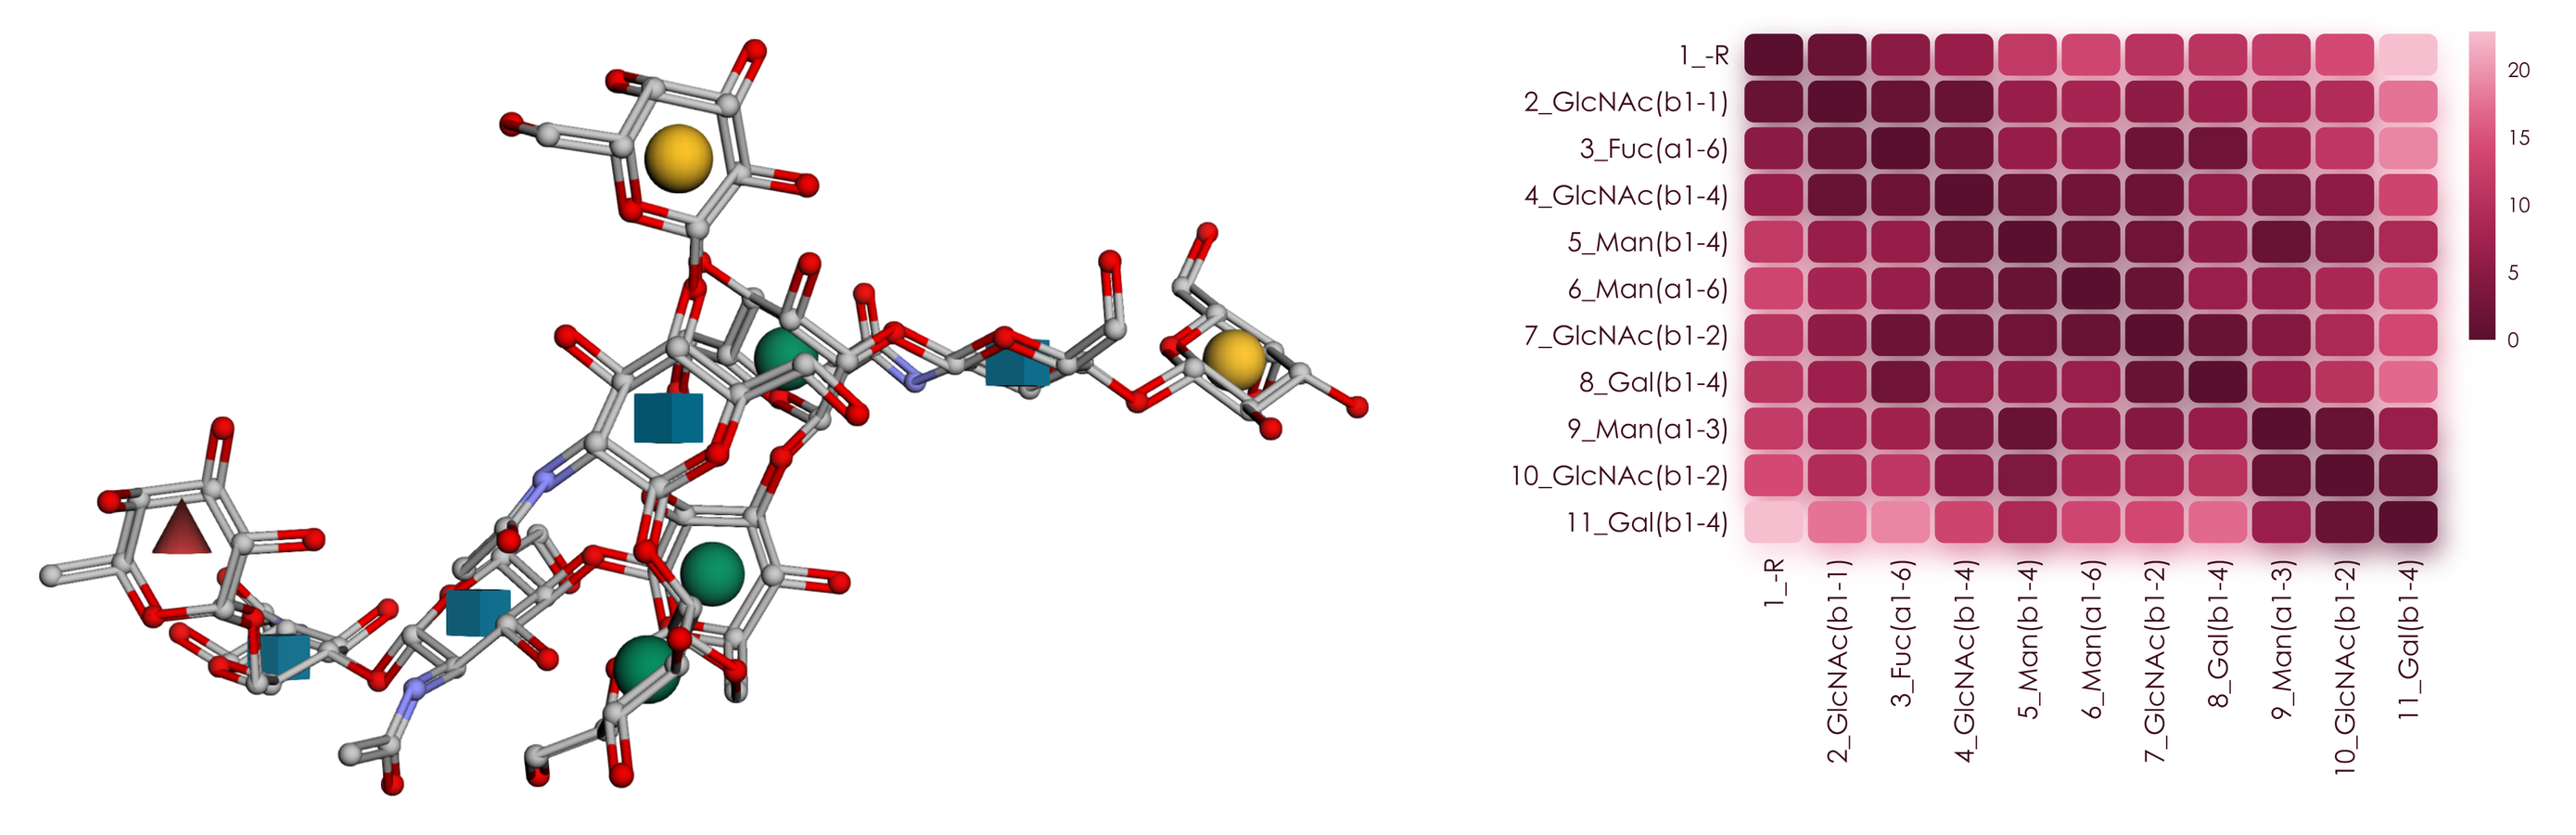
Glycans are branched and flexible, so much of their function lives in a 3D landscape that a linear sequence only hints at. GlyContact connects the sequence you already have to atomic-resolution structures from GlycoShape molecular dynamics, NMR, or X-ray crystallography, and turns them into numbers, figures, and machine learning features.
- Sequence in, structures out. Pass an IUPAC sequence and GlyContact fetches its conformers from the GlycoShape API and caches them. Your own PDB files work the same way, through
my_path. - Ensembles, not snapshots. Contact frequencies, torsions, and hydrogen bonds are computed across conformer clusters and weighted by their populations.
- Free, bound, and attached. Binding pockets, per-contact interaction classes, and glycan shielding cover lectin complexes and glycoproteins alike.
- Ready for machine learning. 1,476 annotated structure graphs ship with the package, and the
[ml]extra trains models that sample structure ensembles for any sequence. - Figures worth publishing. Every plot is drawn with viscose, and one word changes its palette.
Documentation: https://bojarlab.github.io/glycontact/ · Examples: lectin complexes and glycoproteins · Cite: Thomès et al., 2025
pip install glycontact
pip install "glycontact[ml]" # adds torch and torch-geometric for the machine learning layerplot_glycan_3D draws any conformer with 3D-SNFG symbols in an interactive py3Dmol view, inside your notebook. The structure at the top of this page comes from this call.
from glycontact.visualize import plot_glycan_3D
glycan = "Gal(b1-4)GlcNAc(b1-2)Man(a1-3)[Gal(b1-4)GlcNAc(b1-2)Man(a1-6)]Man(b1-4)GlcNAc(b1-4)[Fuc(a1-6)]GlcNAc"
plot_glycan_3D(glycan)
Contact maps show which monosaccharides sit close together in space, and so which parts of a glycan act as one surface. You get one table per conformer cluster, with the closest contacts drawn darkest.
from glycontact.process import get_contact_tables
from glycontact.visualize import draw_contact_map
contact_tables = get_contact_tables(glycan, level = "monosaccharide")
draw_contact_map(contact_tables[0], size = 1.0)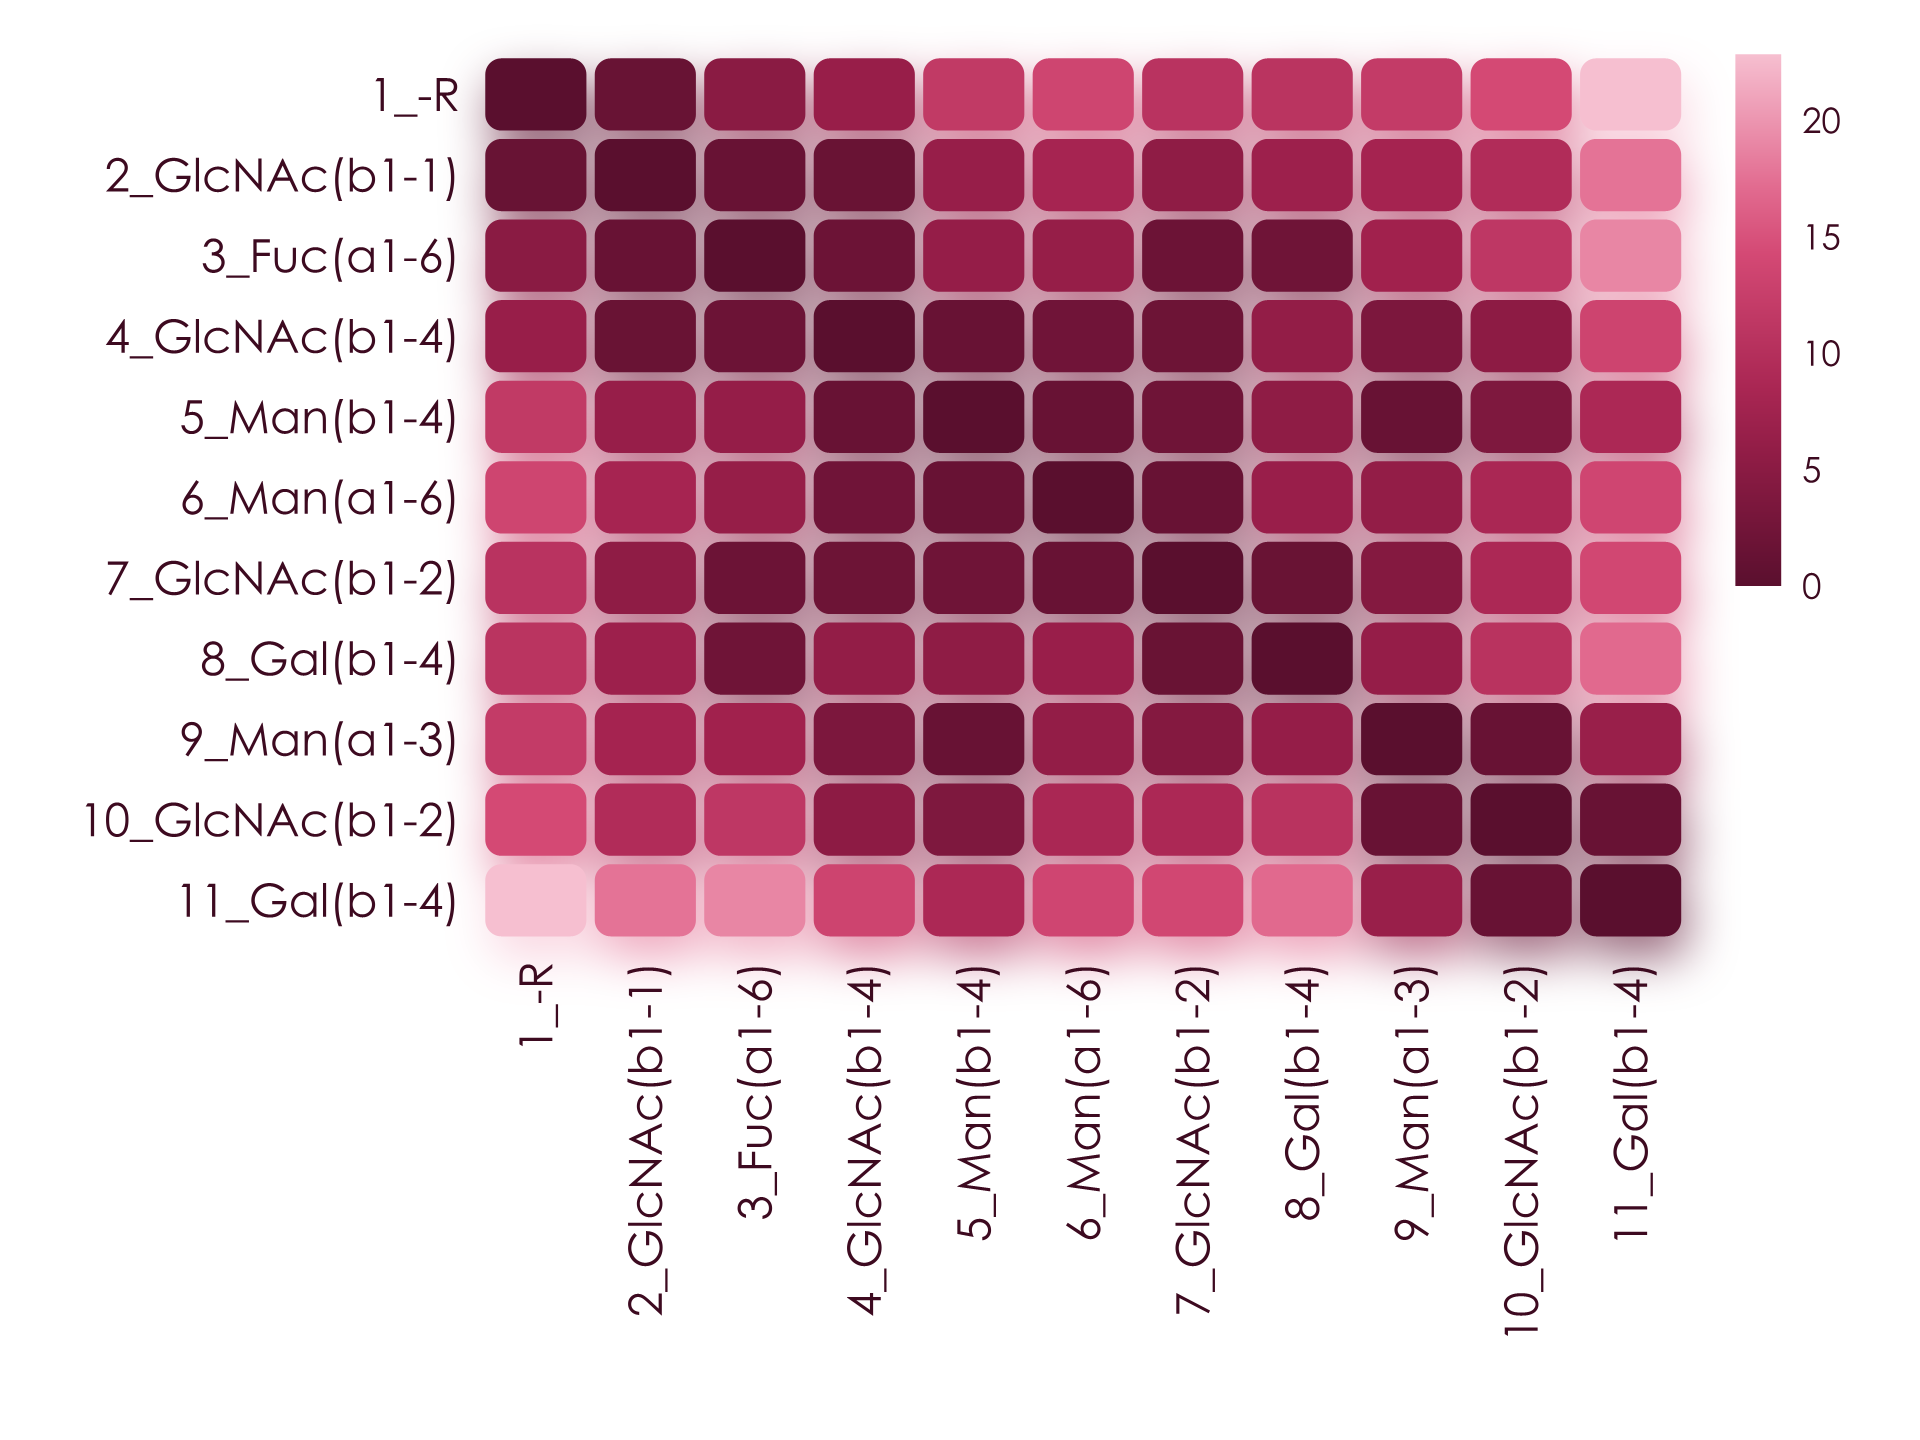
Solvent-accessible surface area and flexibility decide what a binding partner can reach. plot_glycan_score paints them straight onto the SNFG drawing, with the most exposed residues glowing strongest.
from glycontact.visualize import plot_glycan_score
plot_glycan_score(glycan, attribute = "SASA")
Glycosidic torsions set the overall shape of a glycan. ramachandran_plot pools them across every structure that carries a linkage.
from glycontact.visualize import ramachandran_plot
fig = ramachandran_plot("Gal(b1-4)GlcNAc")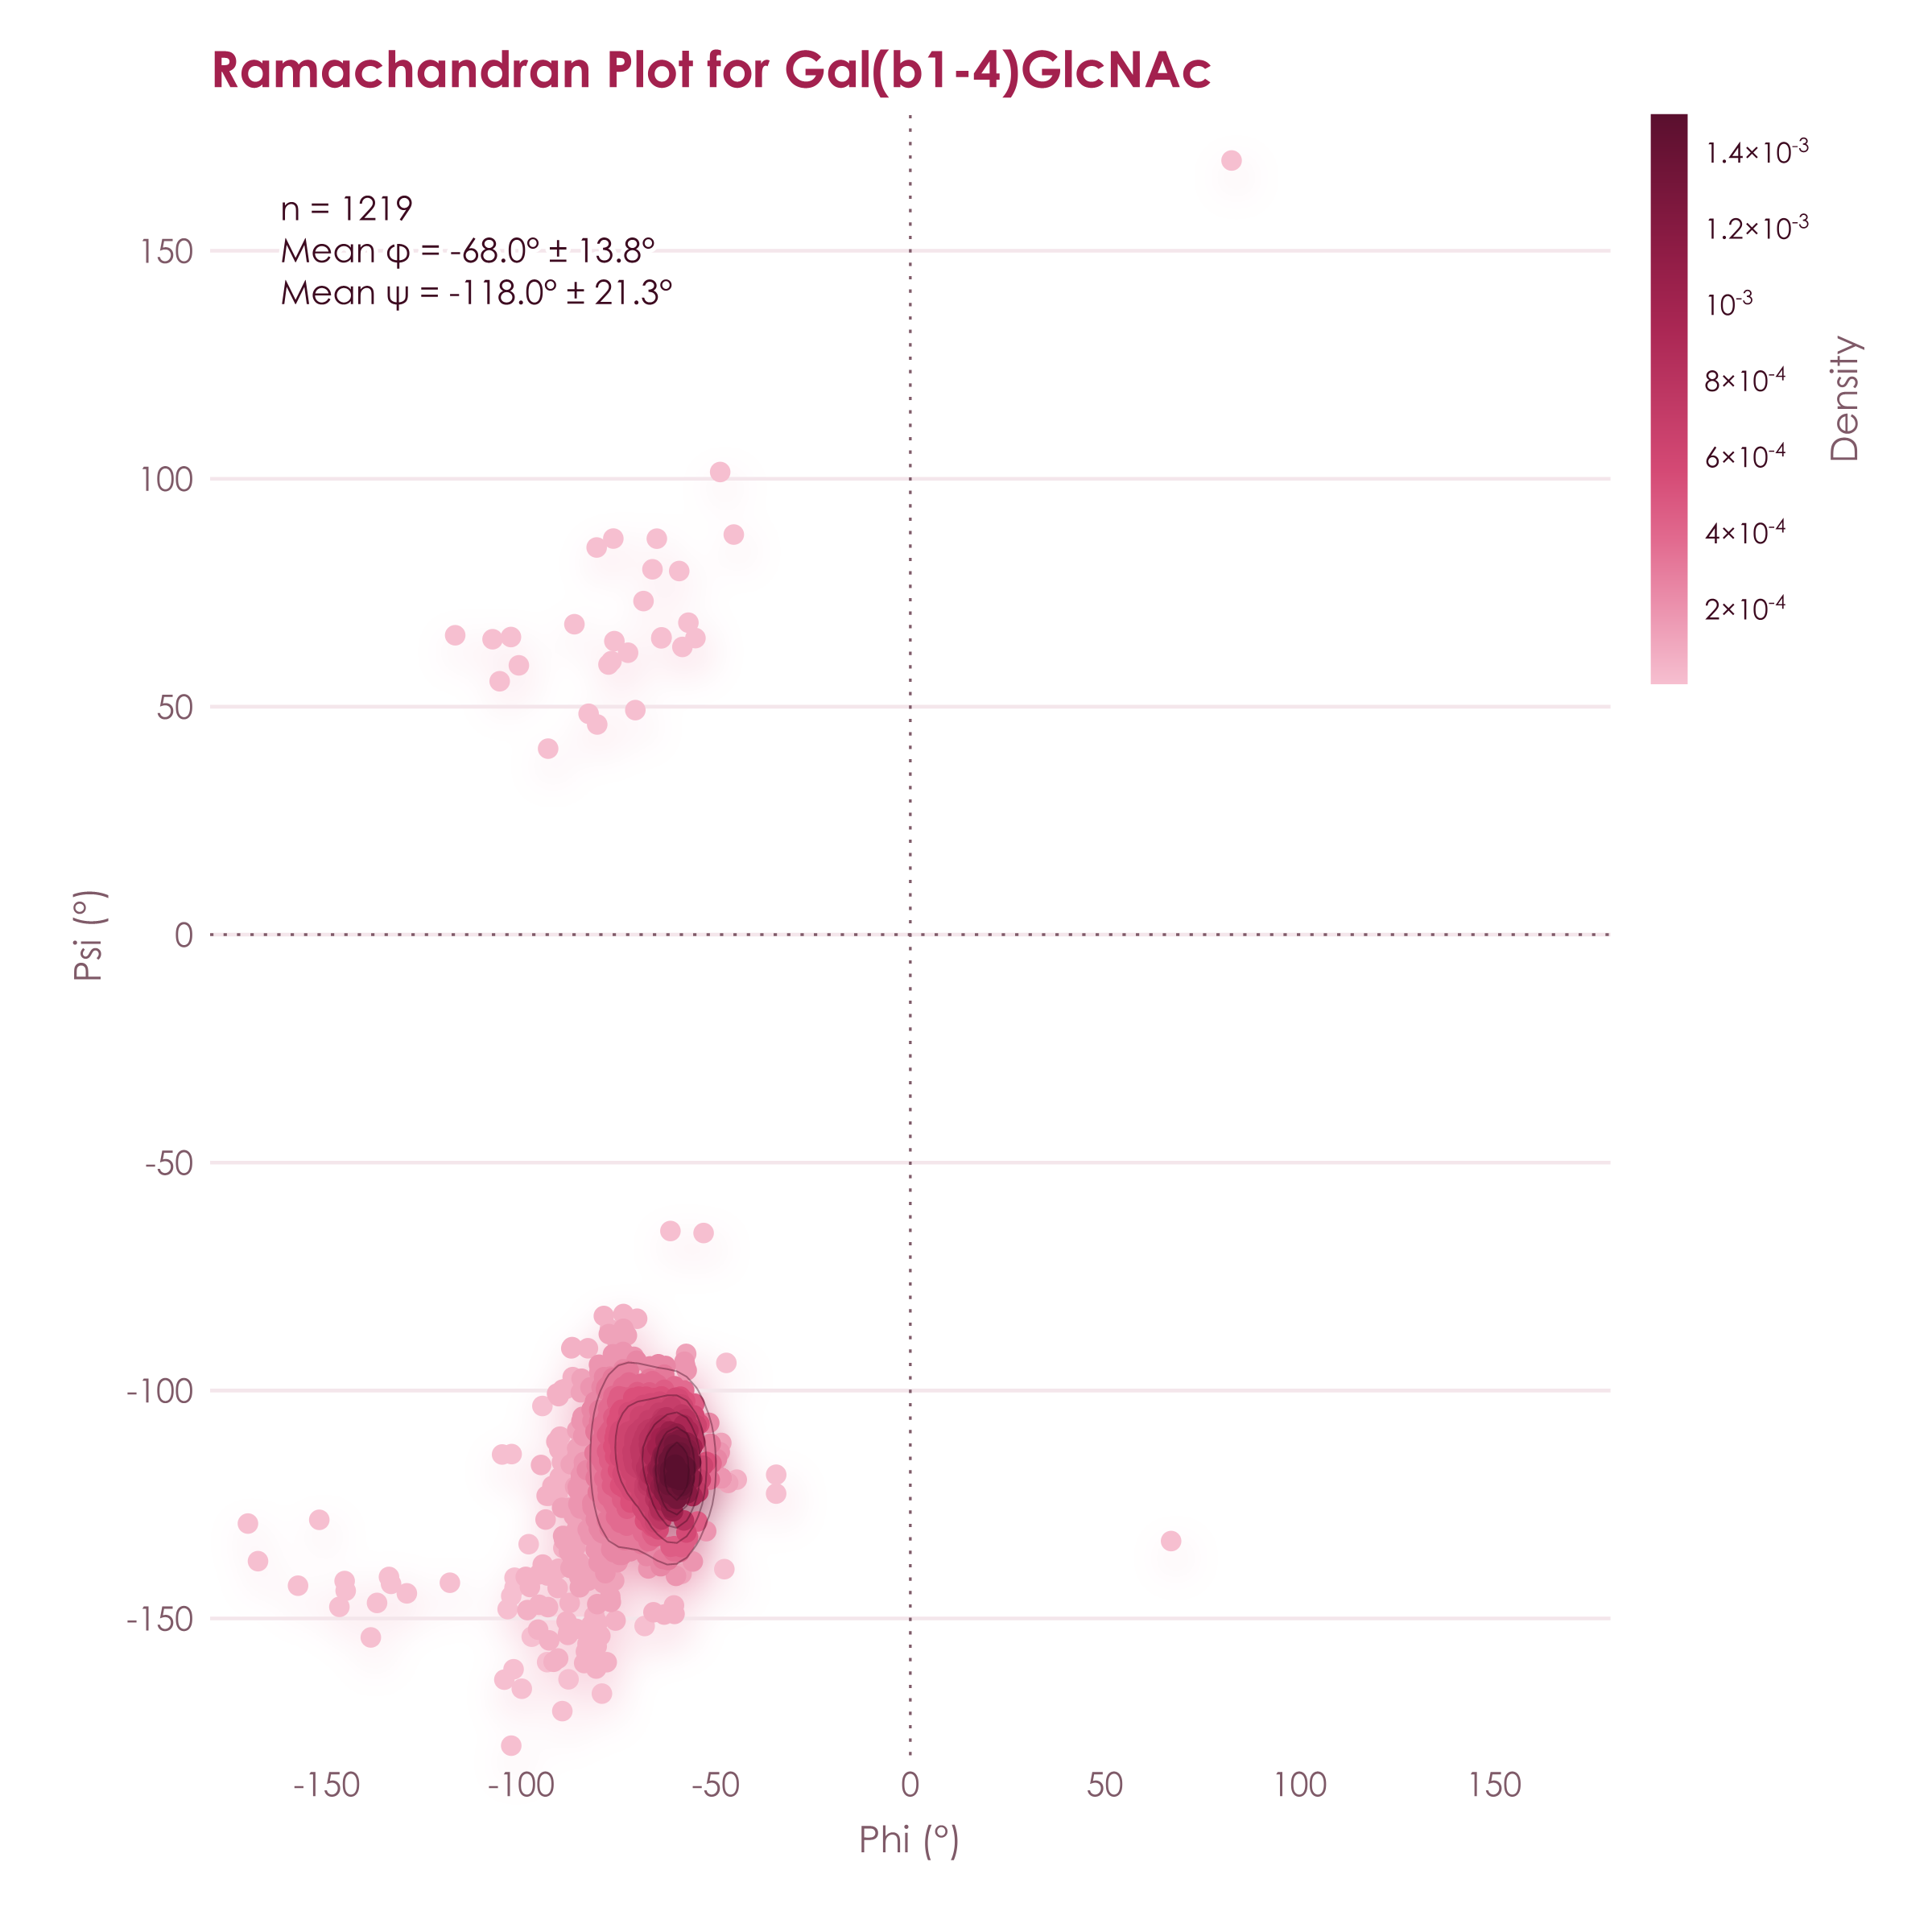
get_linkage_conformations gives the same view for one glycan, weighted by conformer population and with gg/gt/tg rotamers for linkages to O6.
from glycontact.process import get_linkage_conformations
print(get_linkage_conformations(glycan).head().to_string(index = False))
linkage n_conformers phi_mean phi_sd psi_mean psi_sd omega_mean omega_sd gg gt tg
10_NAG-9_MAN 5 -80.07 12.60 167.23 5.29 NaN NaN NaN NaN NaN
11_GAL-10_NAG 5 -64.52 5.33 -116.76 8.54 NaN NaN NaN NaN NaN
3_FUC-2_NAG 5 -76.55 2.46 177.25 13.46 -83.72 10.23 1.0 0.0 0.0
4_NAG-2_NAG 5 -76.48 3.29 -121.53 9.13 NaN NaN NaN NaN NaN
5_BMA-4_NAG 5 -84.01 38.24 -123.50 15.52 NaN NaN NaN NaN NaN
get_hydrogen_bonds finds the inter-residue hydrogen bonds that hold a conformation together, with their occupancy across the ensemble.
from glycontact.process import get_hydrogen_bonds
print(get_hydrogen_bonds(glycan).head().to_string(index = False))
donor_residue donor donor_atom acceptor_residue acceptor acceptor_atom occupancy distance angle
10 GlcNAc(b1-2) O3 11 Gal(b1-4) O5 0.8 3.00 141.68
4 GlcNAc(b1-4) N2 3 Fuc(a1-6) O2 0.6 3.01 156.65
2 GlcNAc(b1-1) O3 4 GlcNAc(b1-4) O5 0.6 2.80 141.05
7 GlcNAc(b1-2) O3 8 Gal(b1-4) O5 0.6 2.80 159.19
3 Fuc(a1-6) O2 7 GlcNAc(b1-2) O3 0.4 2.79 157.55
find_difference compares every pair of glycans that differ only by a motif and tests the change in any structural property.
from glycontact.process import structure_graphs
from glycontact.visualize import find_difference
result = find_difference(list(structure_graphs), pattern = "[Fuc(a1-6)]", metric = "SASA", plot = True)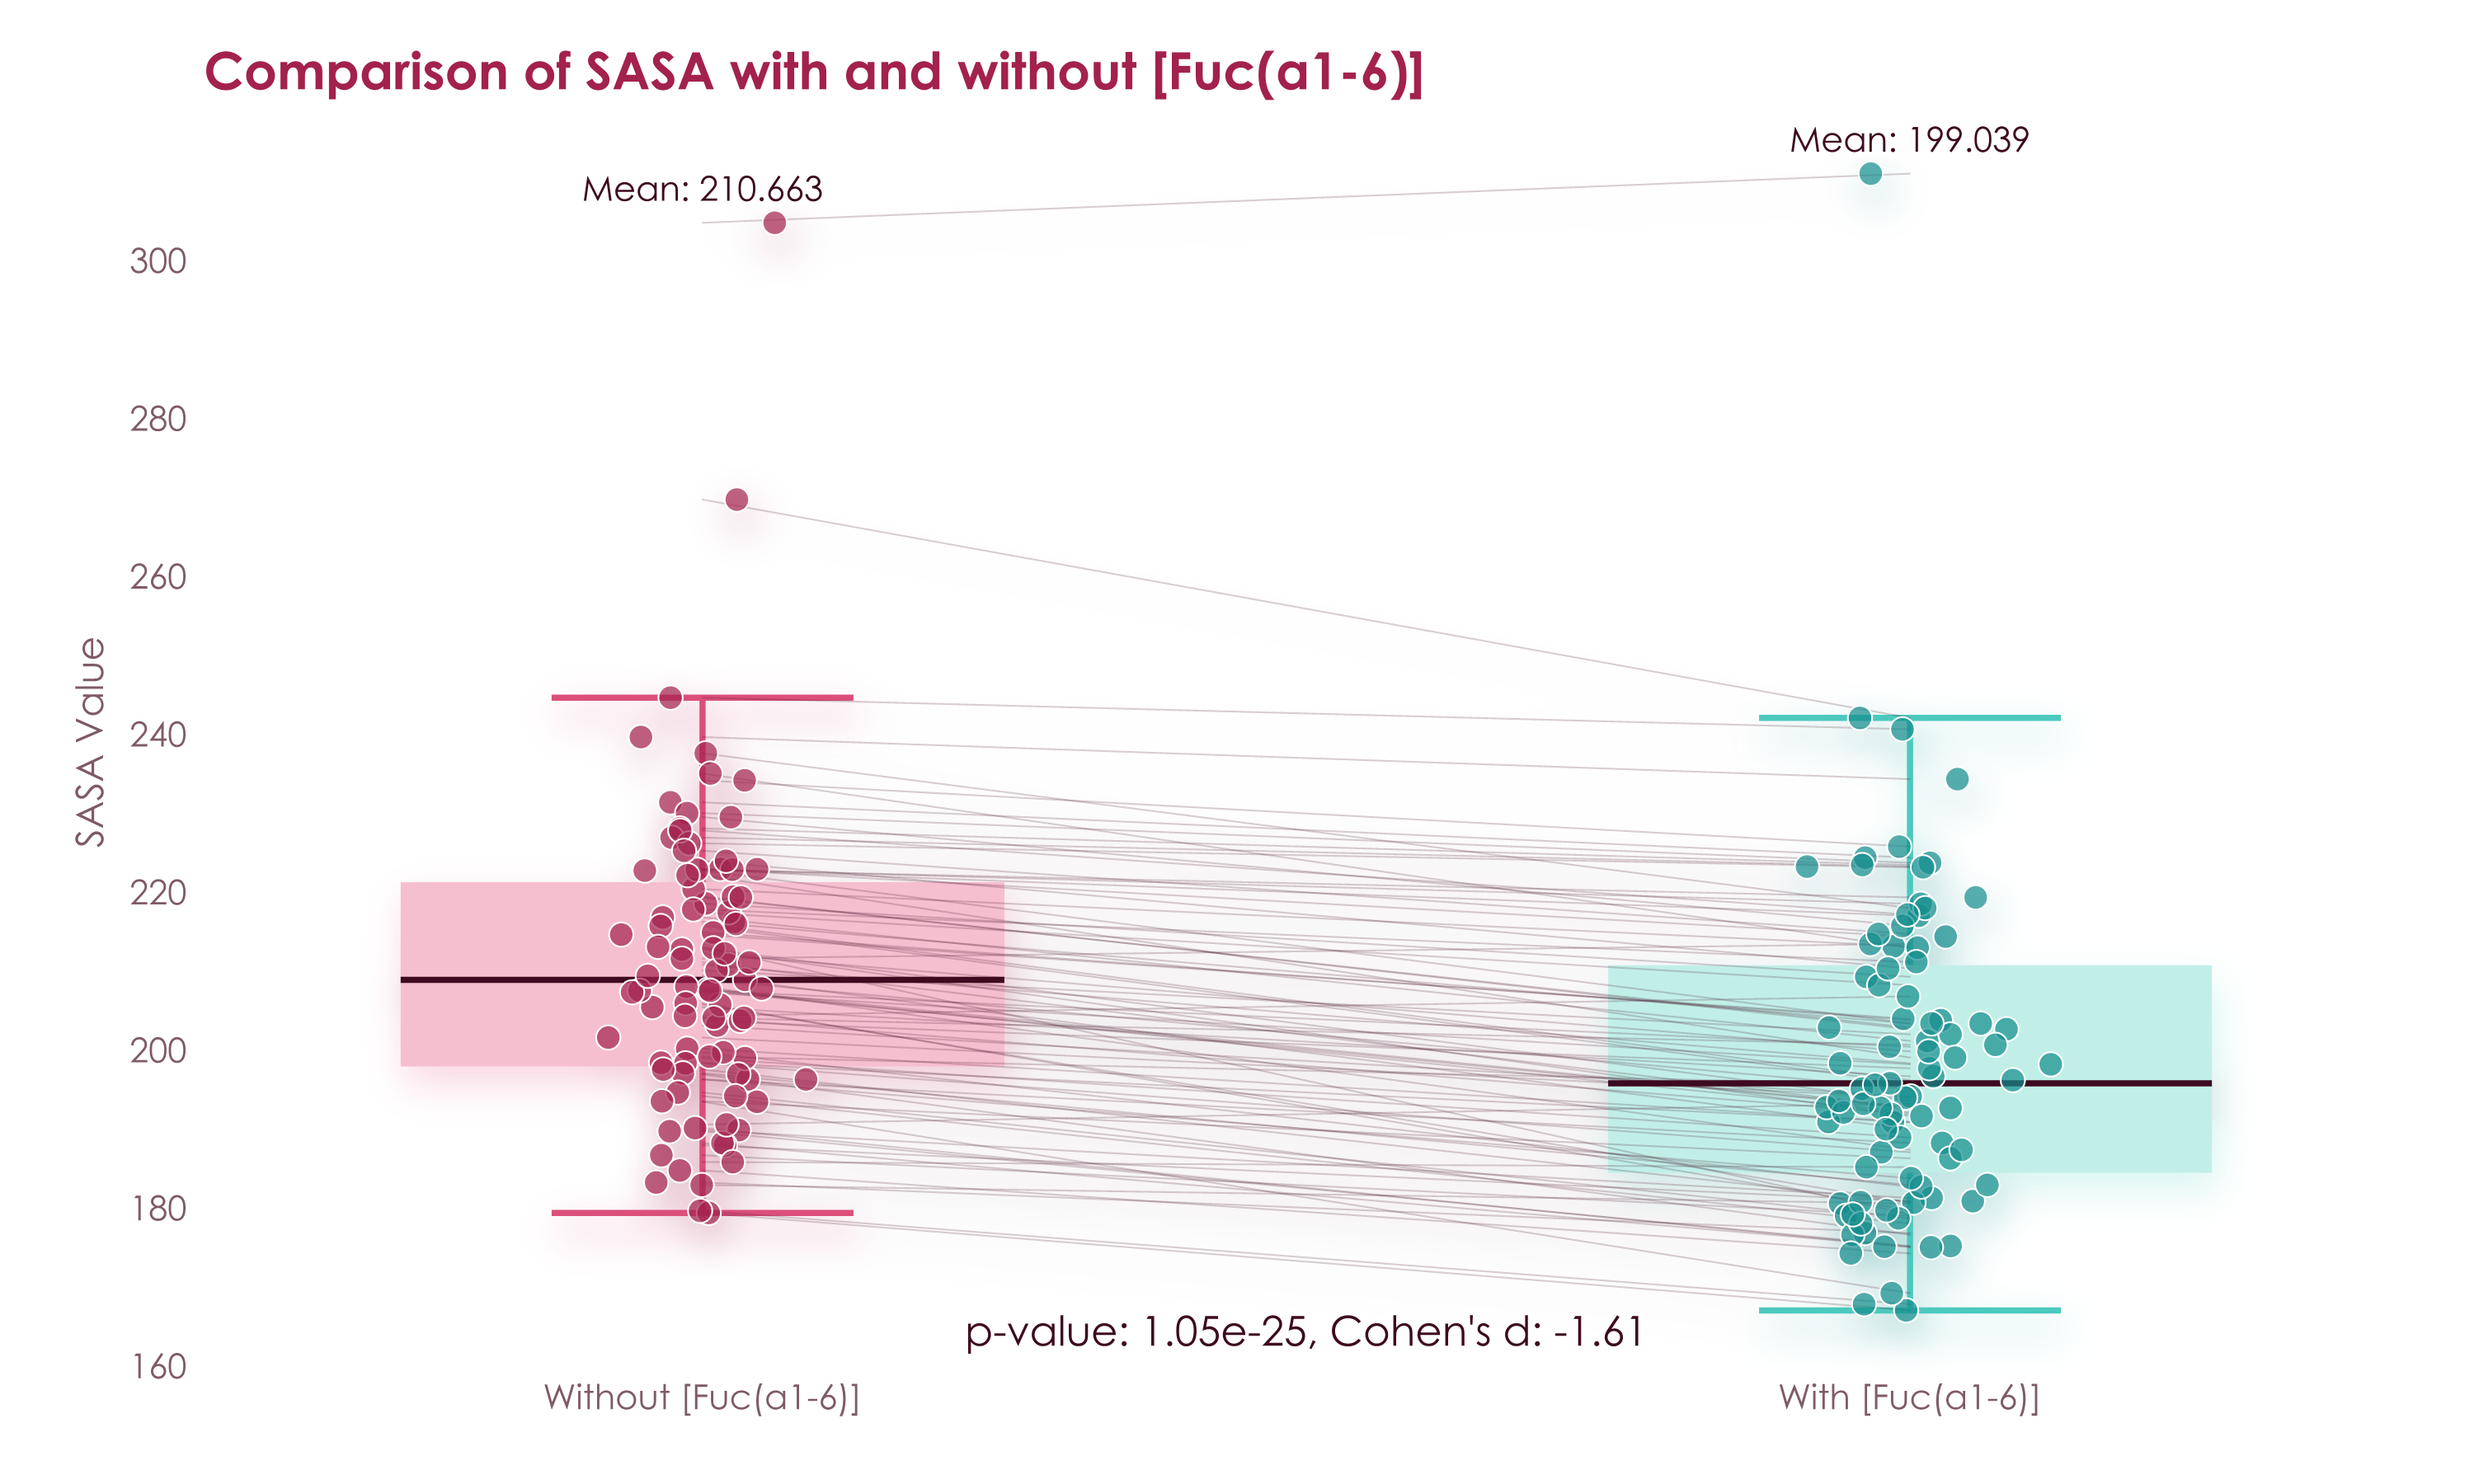
glycontact.structure works on any PDB file. It reads the glycans out of it and classifies every contact with the protein into hydrogen bonds, CH-π stacking, metal coordination, covalent bonds, and van der Waals contacts.
from glycontact.structure import get_glycan_sequences_from_pdb, get_glycan_protein_interactions
print(get_glycan_sequences_from_pdb("3ZW1.pdb"))
interactions = get_glycan_protein_interactions("Fuc(a1-3)[Gal(b1-4)]GlcNAc(b1-3)Gal", "3ZW1.pdb")
print(interactions.head().to_string(index = False))
['Fuc(a1-3)[Gal(b1-4)]GlcNAc(b1-3)Gal', 'Fuc(a1-3)GlcNAc']
glycan_chain glycan_residue IUPAC glycan_atom chain resSeq resName protein_atom distance interaction
D 4_GAL Gal(b1-4) O6 A 8 TRP NE1 3.254790 hydrogen_bond
D 3_FUC Fuc(a1-3) O5 A 15 ARG NH2 2.825438 hydrogen_bond
D 3_FUC Fuc(a1-3) O4 A 15 ARG NE 2.905937 hydrogen_bond
D 3_FUC Fuc(a1-3) O5 A 15 ARG NE 3.352896 hydrogen_bond
D 4_GAL Gal(b1-4) C6 A 15 ARG NH2 3.831360 van_der_Waals
Every plotting function takes palette, and viscose.set_palette sets one for a whole session.
fig = ramachandran_plot("Gal(b1-4)GlcNAc", palette = "lumen")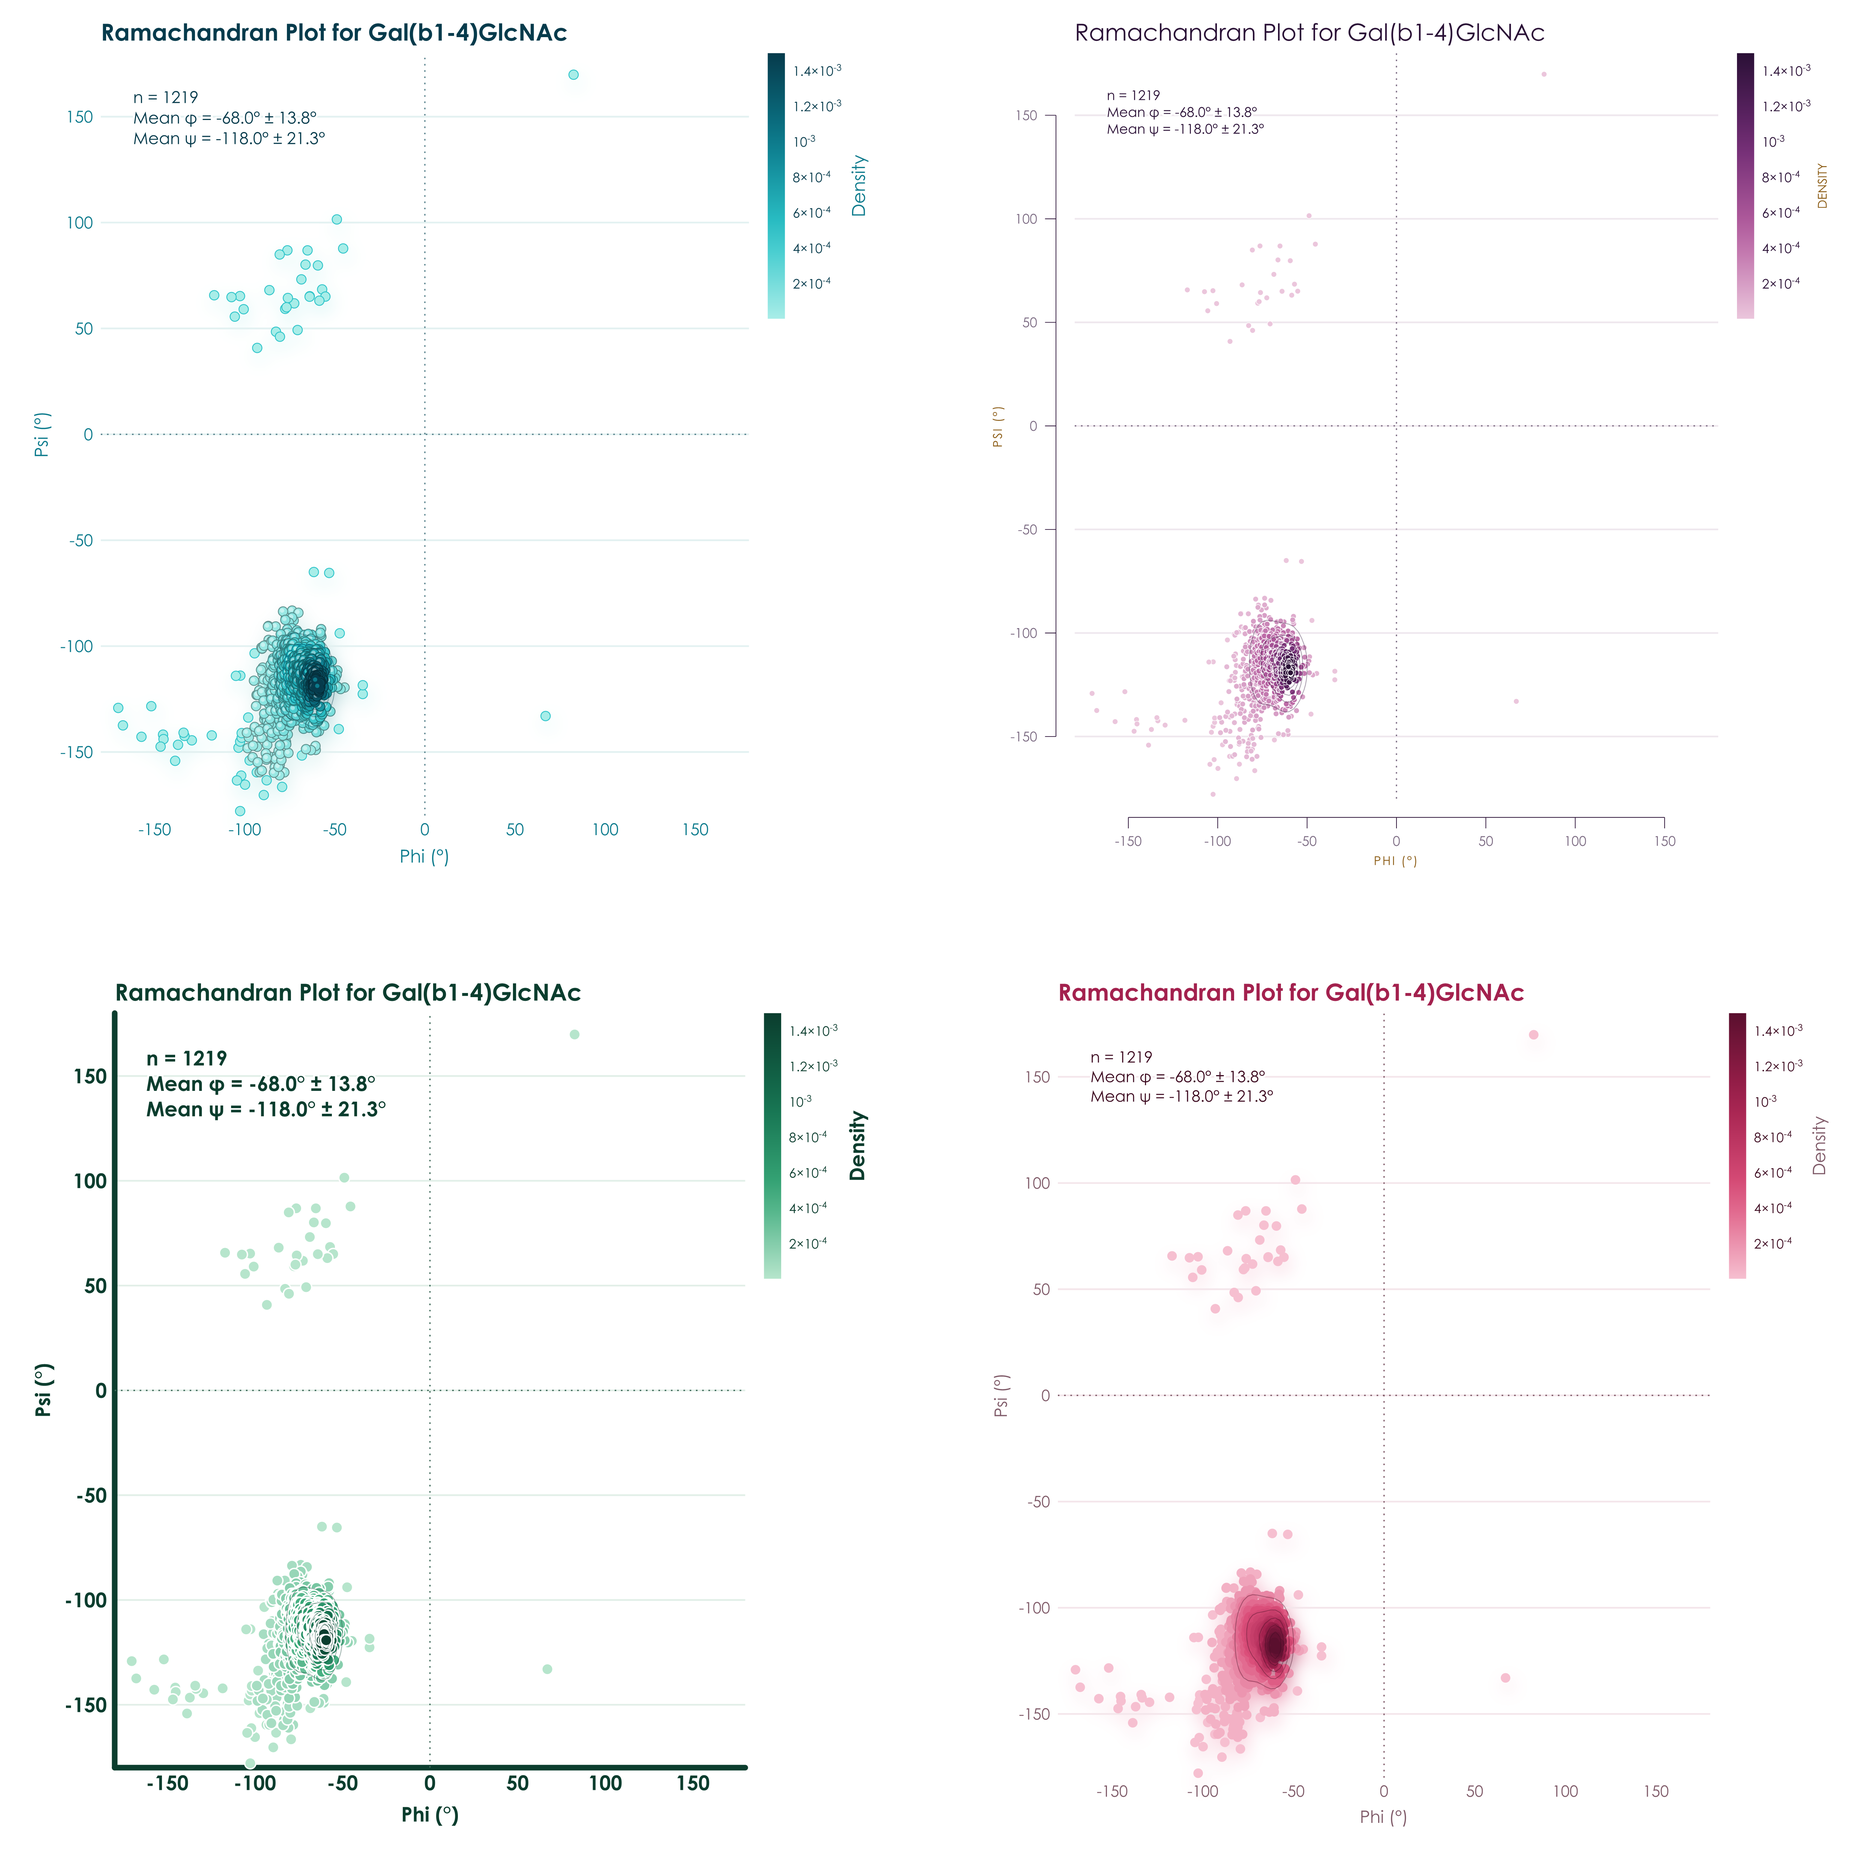
| Retrieve | download_from_glycoshape, get_example_pdb, fetch_pdbs, convert_ID, get_all_clusters_frequency, extract_3D_coordinates |
| Contacts | get_contact_tables, make_atom_contact_table, make_monosaccharide_contact_table, inter_structure_frequency_table, inter_structure_variability_table |
| Surface and flexibility | get_sasa_table, compute_merge_SASA_flexibility, calculate_torsion_flexibility_per_residue |
| Geometry | get_glycosidic_torsions, get_linkage_conformations, get_ring_conformations, get_hydrogen_bonds, analyze_torsion_torsion_correlations |
| Proteins | get_binding_pocket, get_glycan_shielding, get_glycan_protein_interactions, get_glycan_sequences_from_pdb, annotation_pipeline |
| Comparison | superimpose_glycans, get_similar_glycans, find_difference |
| Plots | draw_contact_map, plot_glycan_3D, plot_glycan_score, plot_superimposed_glycans, plot_monosaccharide_instability, ramachandran_plot, show_correlations, show_correlation_dendrogram, make_gif |
| Machine learning | get_all_structure_graphs, create_dataset, train_model, evaluate_model, predict_structure_ensemble, GINSweetNet, VonMisesSweetNet |
The documentation covers each of them, and examples.ipynb and ConformerLearning.ipynb walk through lectin complexes, glycoproteins, and conformer prediction.
If you use GlyContact in your research, please cite Thomès et al., GlyContact analyzes glycan 3D structures at scale. Nat Commun 16:11136, 2025.
Contributions are welcome, so please feel free to open a pull request. GlyContact is released under the MIT License, as detailed in the LICENSE file.