Find spectral peaks signal in OBS data
python ./find_harmonics.py doc/testdata.mseed --winlen 600 --kind peak --fmin 0.1 --fmax 0.3
usage: find_harmonics.py [-h] [-k {none,peak,harmonic}] [--nharms NHARMS]
[--fmin FMIN] [--fmax FMAX] [--vmin VMIN]
[--vmax VMAX] [--winlen WINLEN] [--skip_hf]
[--out_path OUT_PATH]
smgr_path
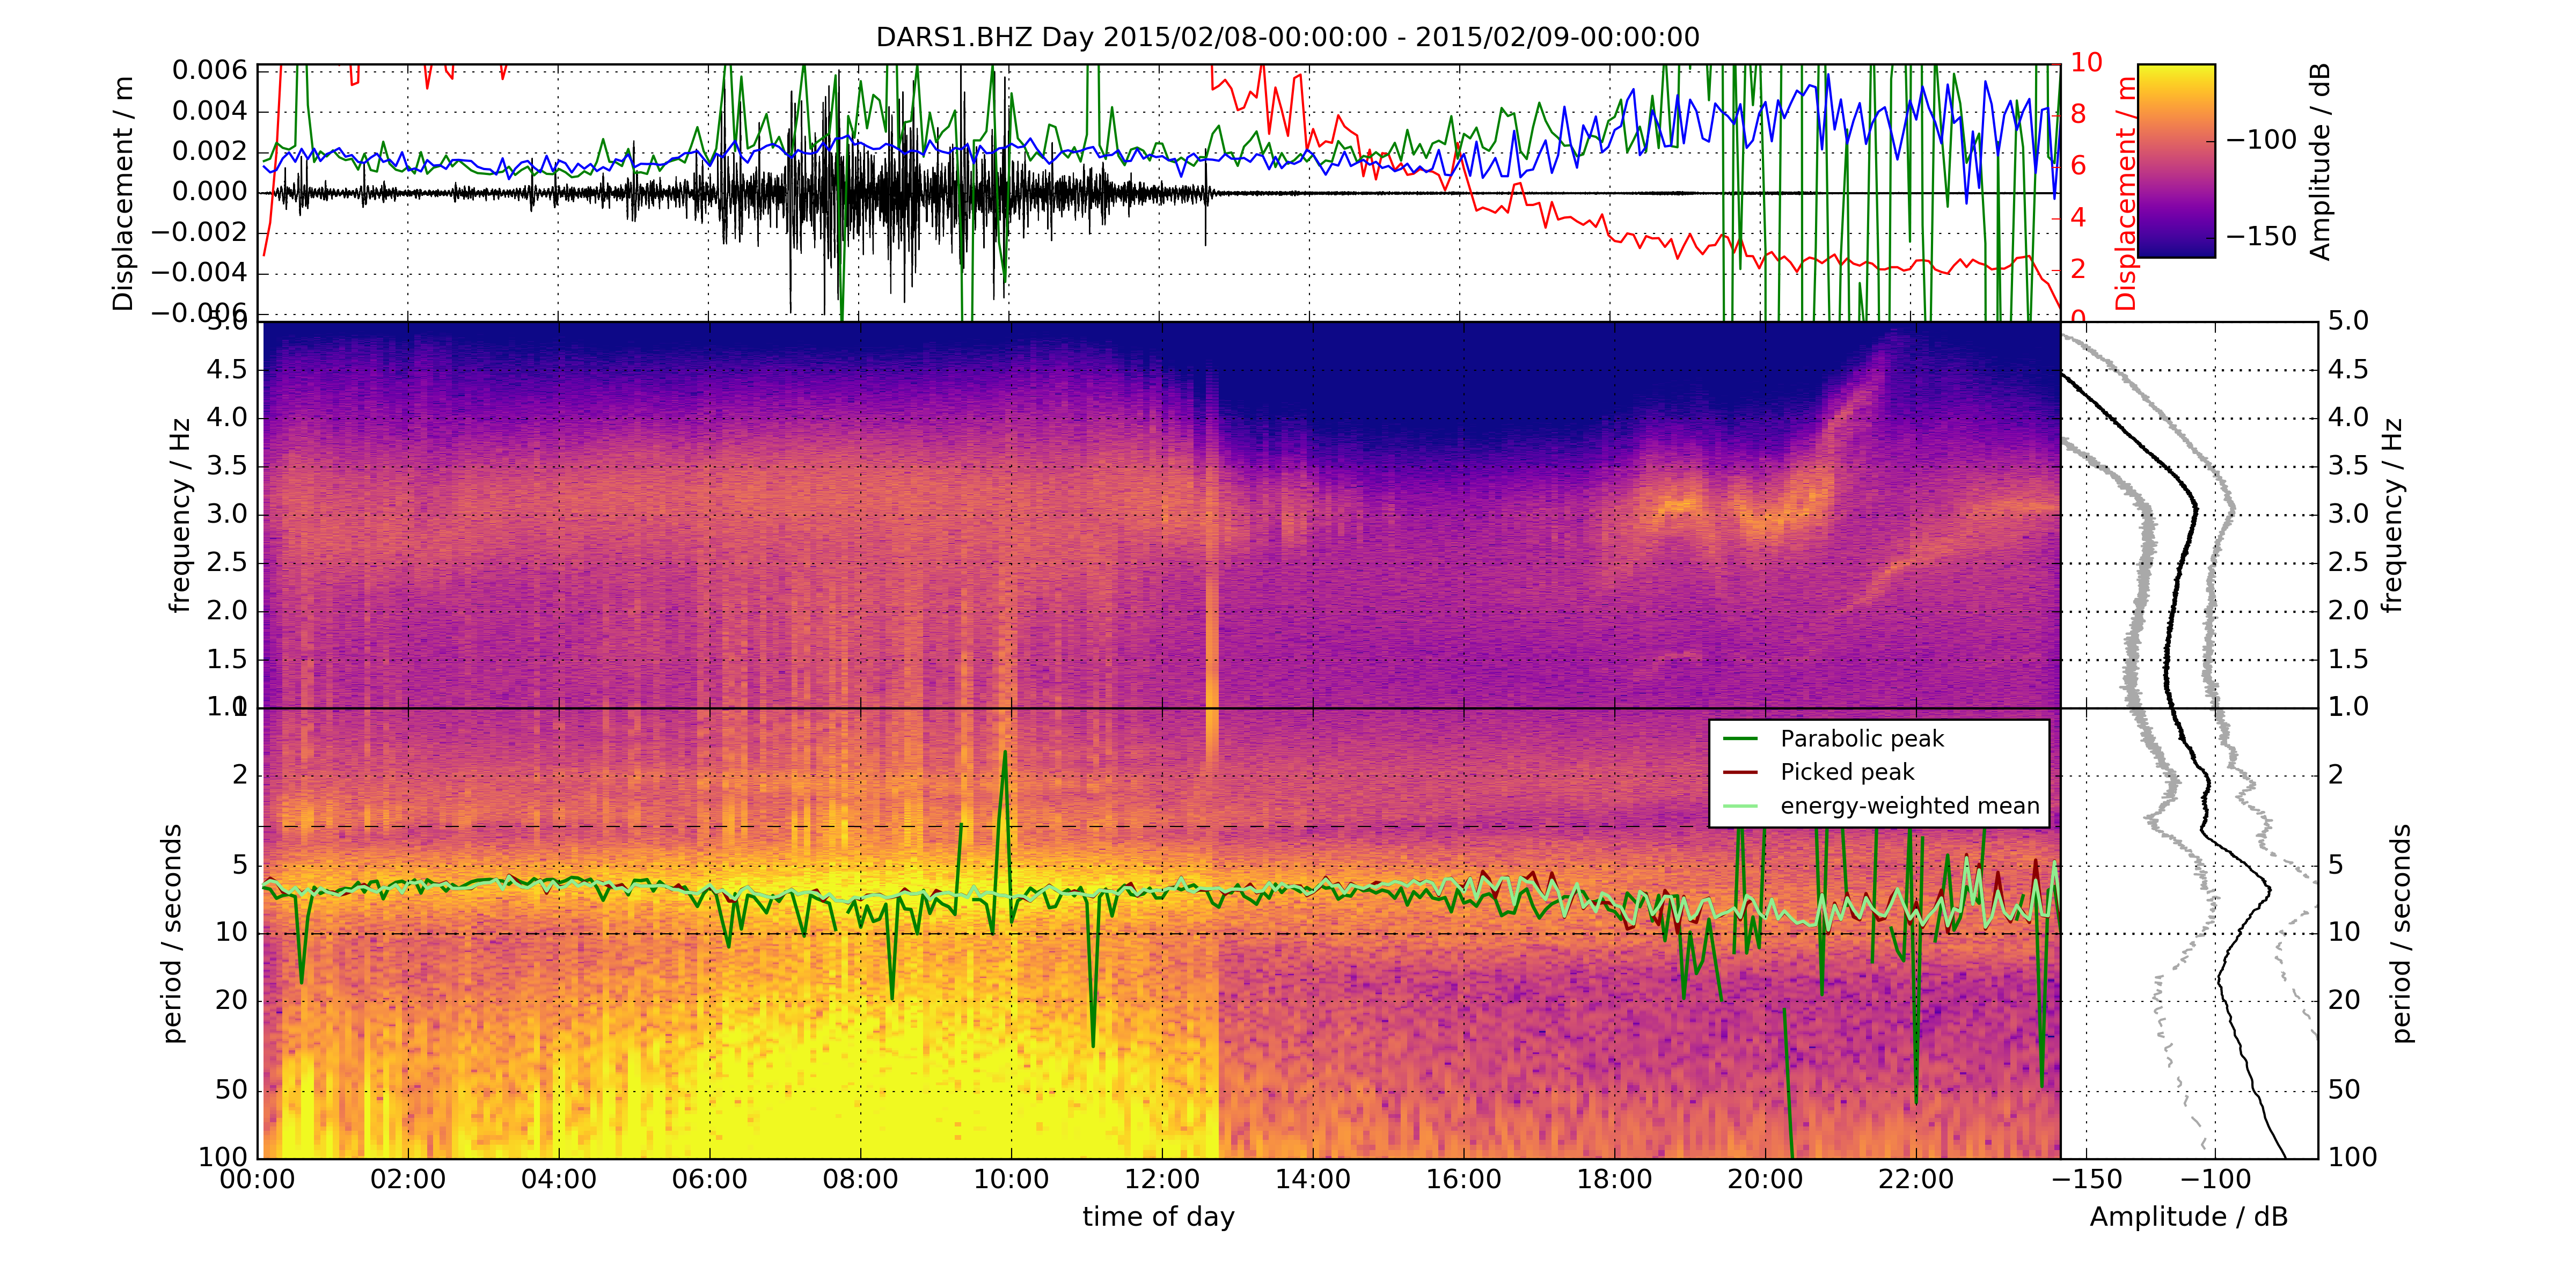
Plot spectrogram and find spectral peaks in in seismogram
positional arguments:
smgr_path Path to Seismogram files (can be anything that Obspy
reads)
optional arguments:
-h, --help show this help message and exit
-k {none,peak,harmonic}, --kind {none,peak,harmonic}
Kind of signal to find. Options: none, harmonic or
peak
--nharms NHARMS Number of harmonics (default: 4)
--fmin FMIN Minimum frequency in Hz (default: 0.4)
--fmax FMAX Maximum frequency in Hz (default: 4.0)
--vmin VMIN Minimum of plot range in dB (default: -160), choose
larger value forhydrophone channel (i.e. -60)
--vmax VMAX Maximum of plot range in dB (default: -60), choose
larger value forhydrophone channel (i.e. 40)
--winlen WINLEN Window length for spectrogram calculation in seconds,
default: 300
--skip_hf Do not plot high frequency part of the seismogram
(above 1 Hz)
--out_path OUT_PATH Output directory (default: .)