This dataset (mimic of real time data) was shared by a startup (that primarily sell internet proxies) who doesn't have a dedicated analytics practice to get a general sense of the generic inferences one could make with regard to their consumer analytics

- Dataset Description
- Exploratory Data Analysis and Data Visualization
- Customer Segmentation
- Churn Prediction
- Future Work
Cancel Table:
- userid - Fake userids and made them email addresses for this one.
- orderid - Unique order # for a given purchase. One customer may have many orders.
- customer_since - Date on which the customer first became a paying customer.
- country - Home country of the customer.
- amount - Order amount, which is typically monthly recurring revenue (MRR).
- Client Status - Current state of customer account. There are three potential values: Active, Inactive, and Closed. The latter two are treated the same for this.
- Order Status - Current state of order.
- billingcycle - Indicates whether this is monthly, quarterly, semi-annual, or annual payments. As noted above on the Amount field, the vast majority of customers pay monthly.
- product - We have a variety of product types, and I simply made this fake data by converting each to a numeric value.
- cancel_date - Self explanatory
- Cancel Count (45 Days) - Count of an individual customer's orders that were cancelled in the last 45 days.
- Active Order Count - Quantity of open orders for a single customer.
- Recurring Amt - A summation of all active order $ amounts for a given customer. It is worth noting that this particular dataset may not have all orders for a customer, so if you sum up the values in the Amount field they are likely not going to total to the Recurring Amt field.
- Customer Type - Indicates whether this customer ever actually paid us any money. Many sign up for trials and then do not convert (which is one of the things I am hoping we can dive into deeper to understand why) and these are marked as 'Trial', whereas all those marked as 'Paying' either converted from trials or directly signed up and skipped the trial process.
Package Table:
- Customer - This correlates to the customer ID in the Cancel table, although you would need to extract it from the email address.
- Name - See note below. In short, this field has confused me for a while so you can likely disregard much of it.
- Category - We sell three types of proxies: Dedicated (meaning a single customer has use), Semi-dedicated (meaning that multiple customers use the same one, but they get to pay a cheaper price as a result), and Rotating (meaning that they pay a set $ amount, and on a periodic basis that is usually around 10 minutes, they rotate amongst a pool of proxies).
- Country - Our proxies IP addresses are in data centers throughout the world, so this is the location of that IP address.
- Type - I'm actually not sure why this field sometimes has a combination of country and category, and usually just says standard.
- Category - These should have been labeled better. The first Category field above is from a proxy packages table, and this one in the far right column is from the history table. So for cancellations, this one is going to be the better to use.
- Assuming Terminated and Cancelled status to be the same due to lack of context on dataset to consider them as individual entities.
- Assuming Closed and Inactive status to be the same due to lack of context on dataset to consider them as individual entities.
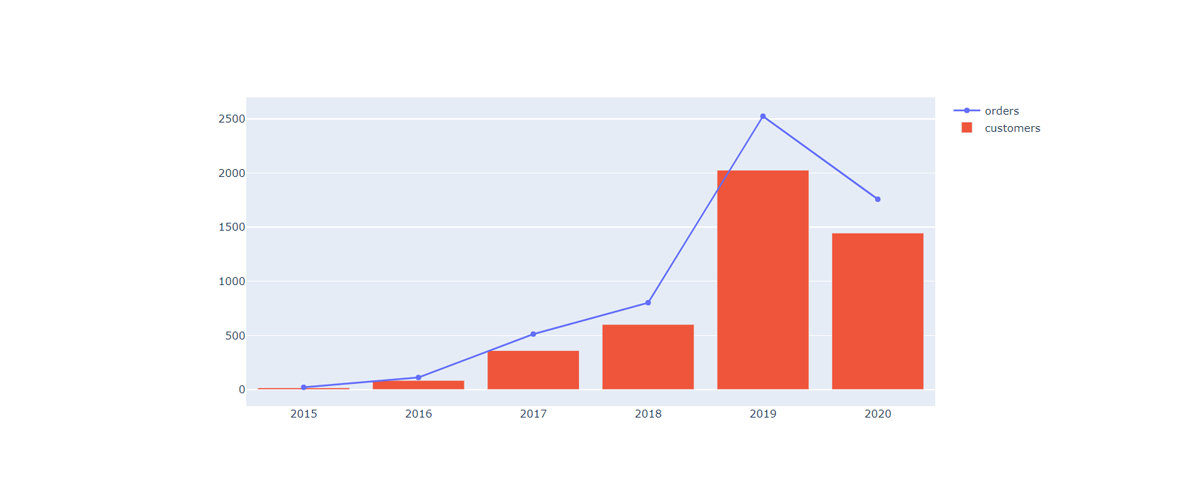
Constasting volume of orders and number of customers year on year
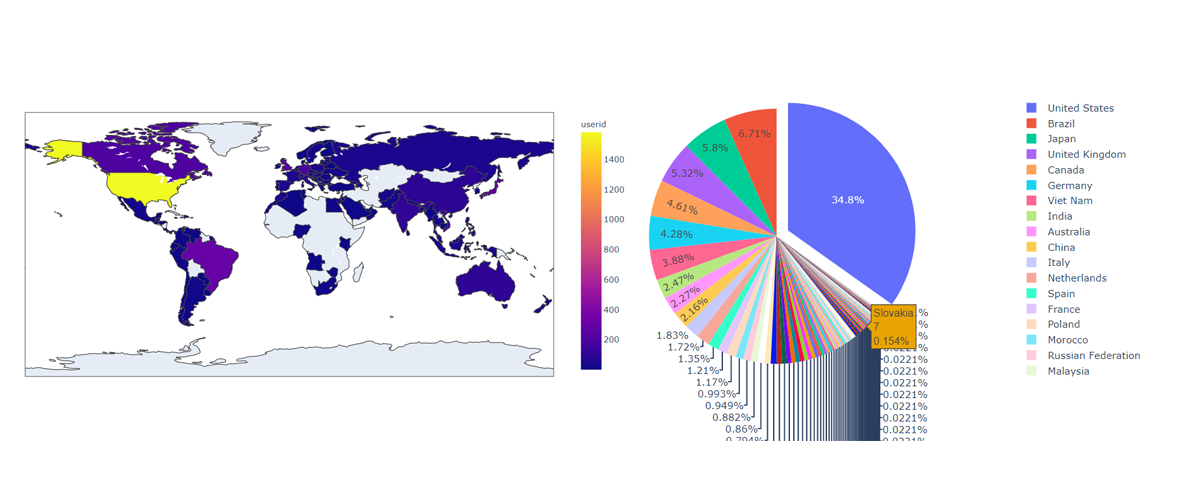
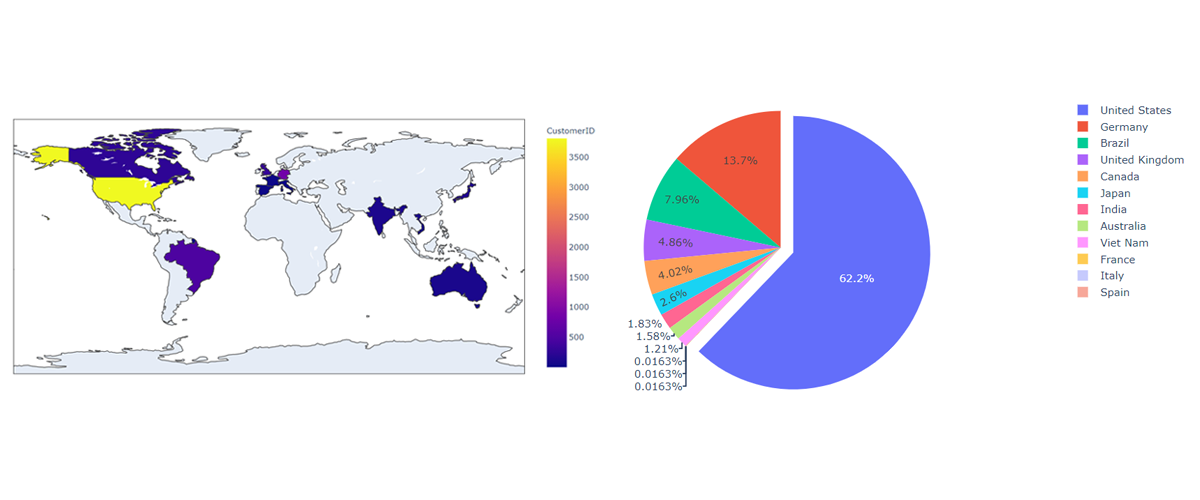
Geographic distribution of customers
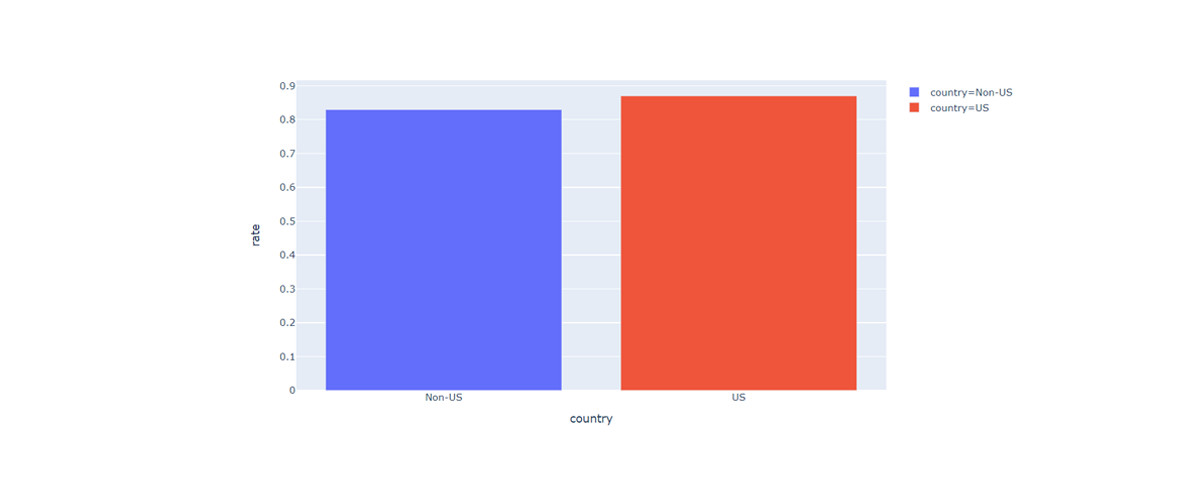
Churn rate of US (Largest consumer base) vs Non US customers
Histogram for most popular products
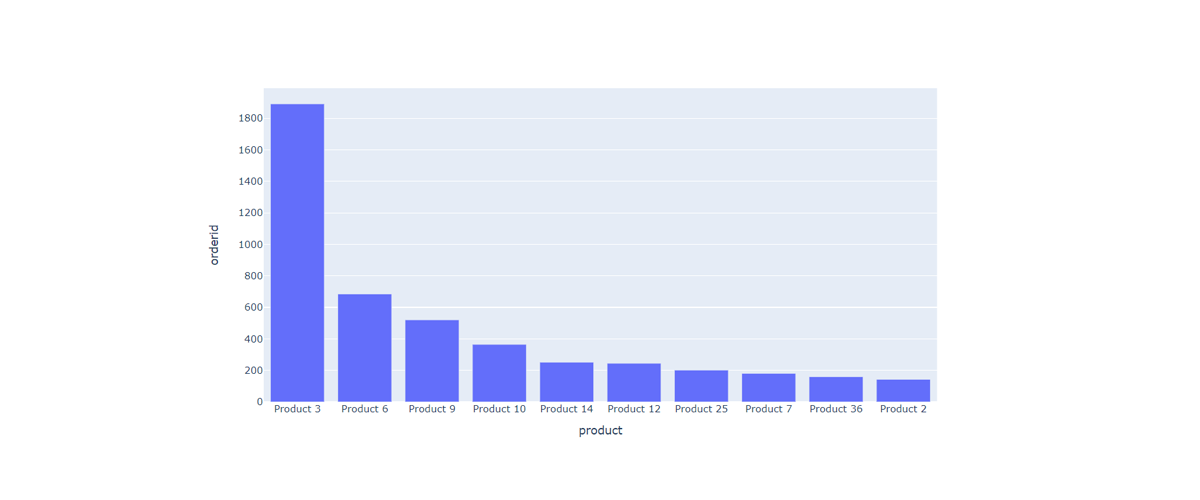
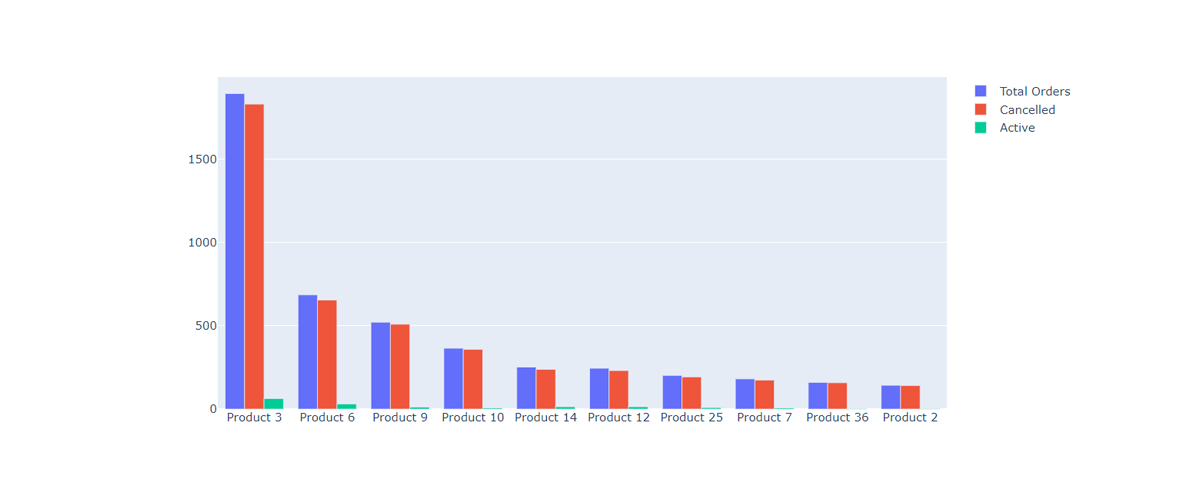
Customer retention of top 10 products
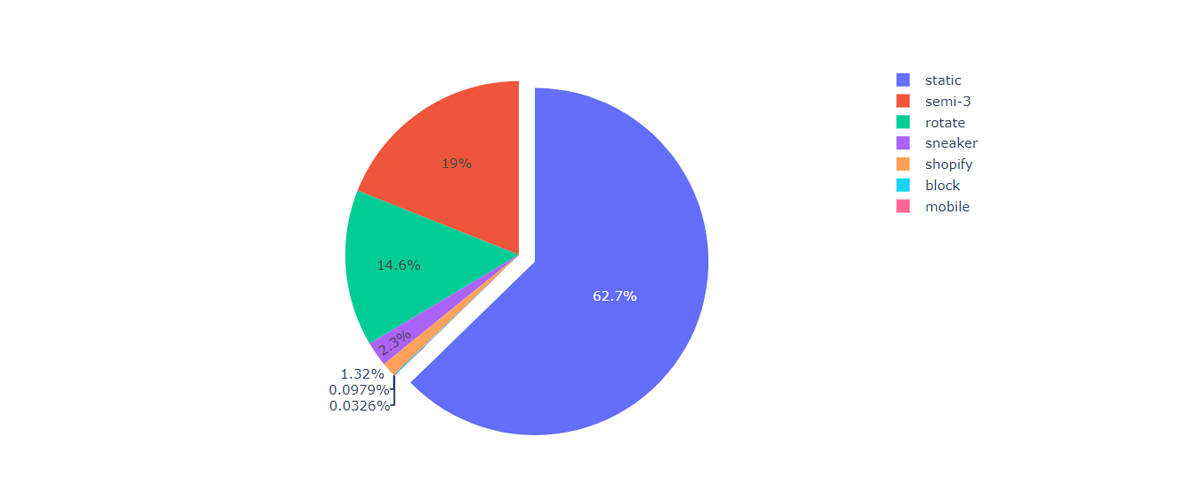
Most popular proxy category
Which data centers handle most of the traffic?
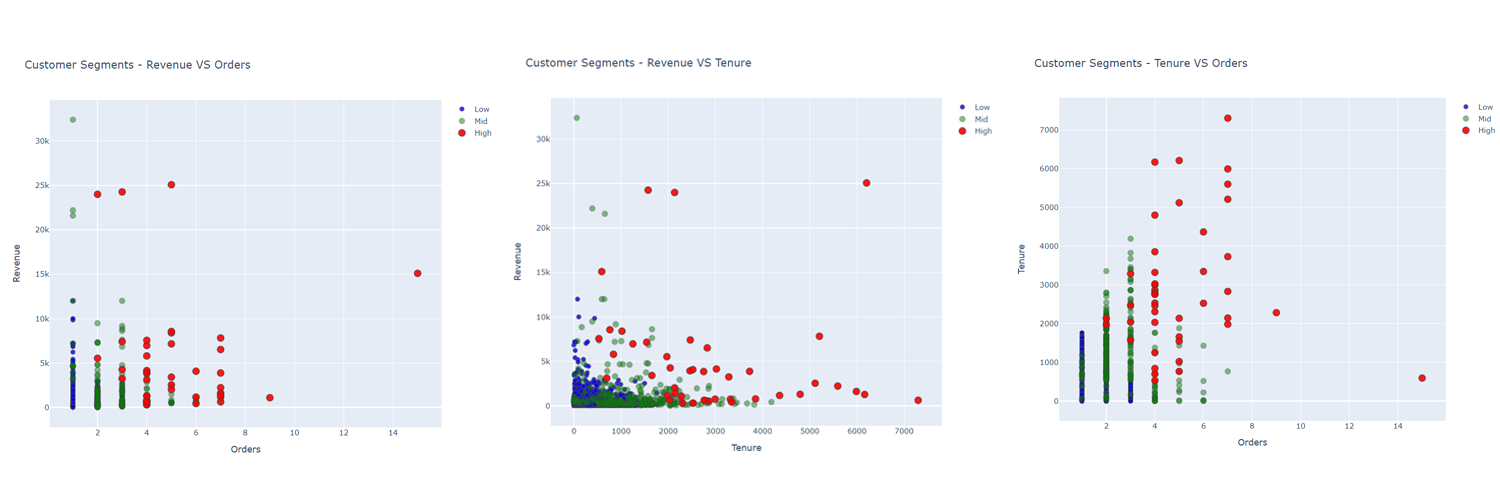
The idea of segmenting customers is to guage the value of the exsisting customers; they were segmented based on the following key attributes:
- Tenure: How long the customer has been with the organization
- Frequency: Number of orders made by a particular customer
- Revenue: The revenue generated by each customer
K-means clustering was used along with the elbow plot to establish the right number of clusters for each of the attributes
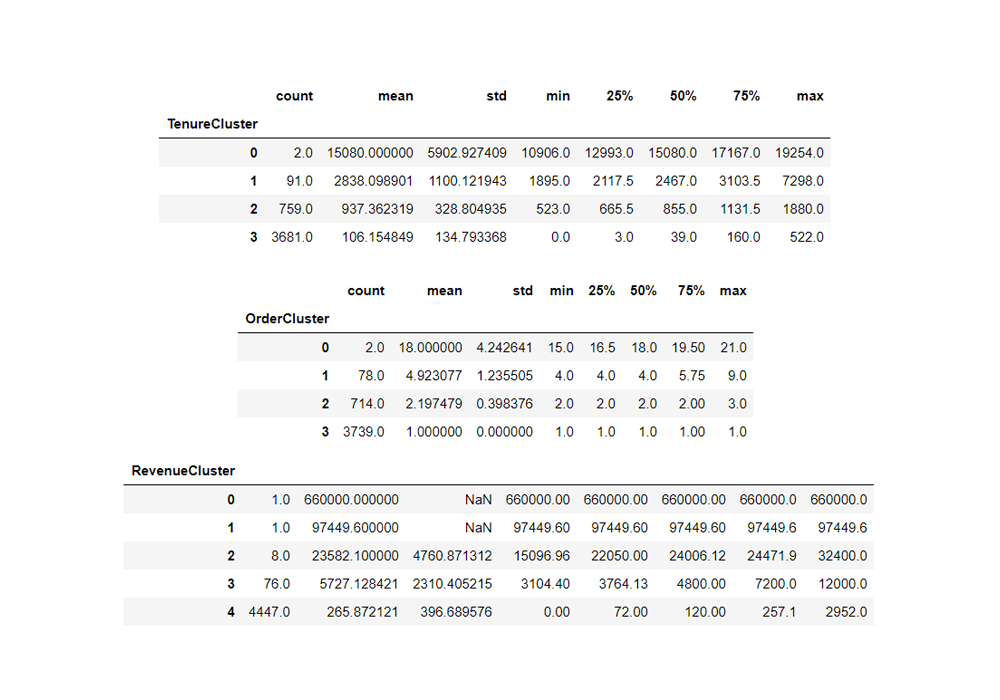
Each of the attributes were given an equal weightage to calculate a score for "customer value". Ideally, it would be better to take a weighted estimate of each cluster. The scoring may be influenced by a biad or due to insufficiency of data which is causing irregualr clusters in terms of revenue.
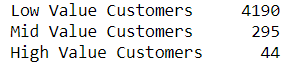
The objective here is to create a model to classify the Status of a client (Active/Inactive) so that it could be utizlized in the future to assess if an Active customer will potentially become an Inactive one.
Model Used: CatBoost Classifier
Test Score Achieved: 91.5%
Classification Report
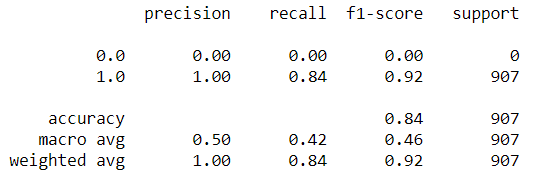
We have a significant number of false positive predictions. We can resolve this by builing models that factor in the imbalance in the data set (by using Cost Sensitive, Data Sampling and Probability Calibration based models) to optimize the classification.
-
Conversion rate from trial to paying : Establishing a conversion rate was attempted but only found one order converted. With better and more accurate data, we can determine which products have a high conversion rate.
-
Working with a join on cancel table and package table to identify trends between cancelled orders with respect to package purchases.
NOTE: Open the .html file to view the plotly visualizations.