Predict if a bank's customer would subscribe to a term deposit. (Constraint of an imbalanced dataset) Determine significant features that help explain the target variable. Customer segmentation to identify key customer groups to target the product to.

- Data Description
- Choosing a Metric
- ML Algorithms with Hyperparameter Tuning
- Cost Sensitive Algorithms
- Data Sampling
- Feature Importance
- Future Work
Features:
- Age
- Job
- Marital Status
- Education
- Loan Default
- Account Balance
- Housing
- Active Loan
- Contact
- Day
- Month
- Duration
Distribution of Categorical Features
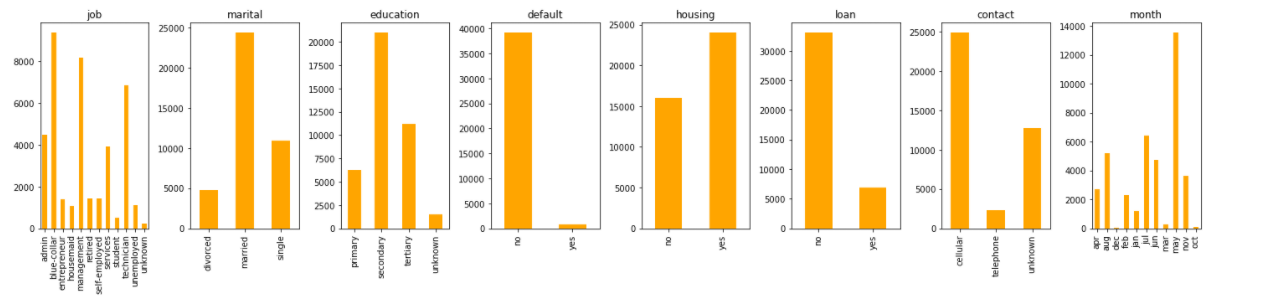
Distribution of Continuous Features

The specified goal requires us to choose the model based on the metric accuracy.
Using accuracy as the metric is not optimal to making the best prediction especially due to the fact that our data set is imbalanced. For Ex: Suppose we have 80% of the data points of just class A ; we can achieve 80% accuracy by just making every prediction A
To achieve an optimal result we would like to maximize two components:
-
The "True Positive Rate" aka Sensitivity aka Recall. Given by: TP/(TP+FN)
-
The Precision - How many of the positive predictions, are in fact correct. Given by: TP/(TP+FP)
To obtain a balance between both we use F Measure which is given by: (2 x Precision x Recall)/(Precision+Recall)

Model Results:
| Model | F2 (Test Score) |
|---|---|
| Logistic Regression (L2 Penalty) | 0.47 |
| Logistic Regression (L1 Penalty) | 0.48 |
| Logistic Regression (Elastic Penalty) | 0.62 |
| KNN | 0.15 |
| Decision Tree | 0.37 |
| Linear SVC | 0.21 |
| Kernel SVC | 0.37 |
| SGD Classifier | 0.58 |
| LDA | 0.31 |
| MLP Classifier | 0.43 |
| Bagging (Decision Tree) | 0.34 |
| Random Forest | 0.3 |
| Gradient Boositing | 0.42 |
| XGBoost | 0.43 |
| CATBoost | 0.42 |
| LightGBM | 0.43 |
The idea behind using Cost Sensitive Algorithms is to given varying weights to each of the classes while building the model in an effort to built better predictors
Model Results:
| Model | F2 (Test Score) |
|---|---|
| Logistic Regression (L2 Penalty) | 0.61 |
| Logistic Regression (Elastic Penalty) | 0.46 |
| Kernel SVC | 0.55 |
| SGD Classifier | 0.59 |
| XGBoost | 0.64 |
| CATBoost | 0.65 |
| LightGBM | 0.65 |
The idea is to change the dataset used to build the models by:
-
Adding copies of instances from the under-represented class aka over-sampling (via various SMOTE methods)
-
Deleting instances from the over-represented class, aka under-sampling
Model Results:
| Model | F2 (Test Score) |
|---|---|
| Logistic Regression (Elastic Penalty) | 0.63 |
| SGD Classifier | 0.62 |
| XGBoost | 0.47 |
| CATBoost | 0.61 |
Since Cost Sensitive CatBoost gave us the best test and validation set scores we will assess CATBoost Feature Importances
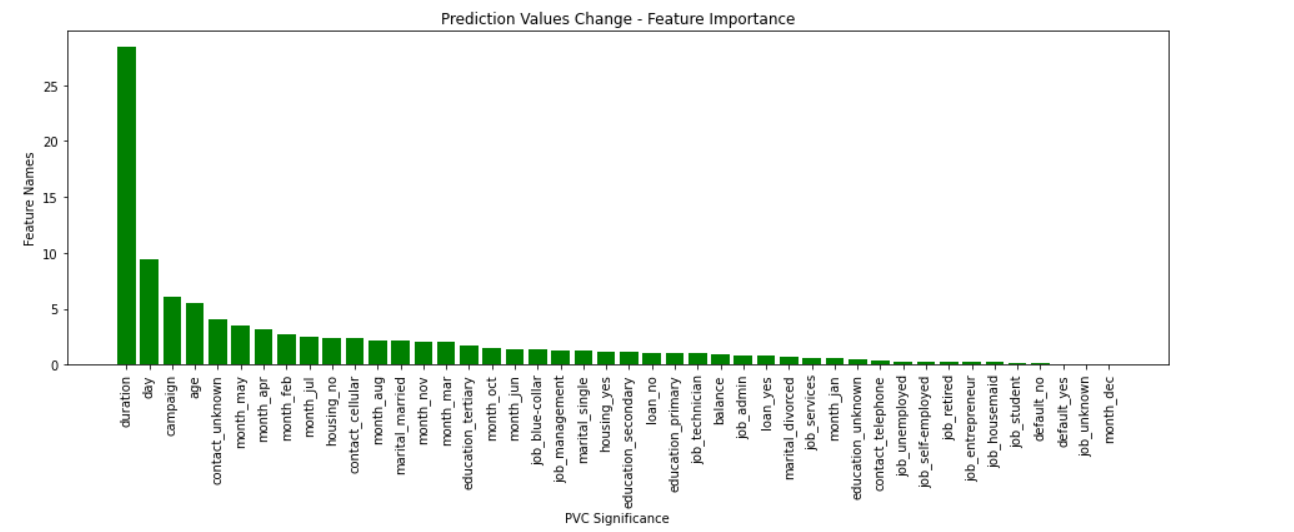
- Prediction Value Change
PredictionValuesChange shows how much on average the prediction changes if the feature value changes. The bigger the value the larger the change to the prediction value on average if this a feature is changed.
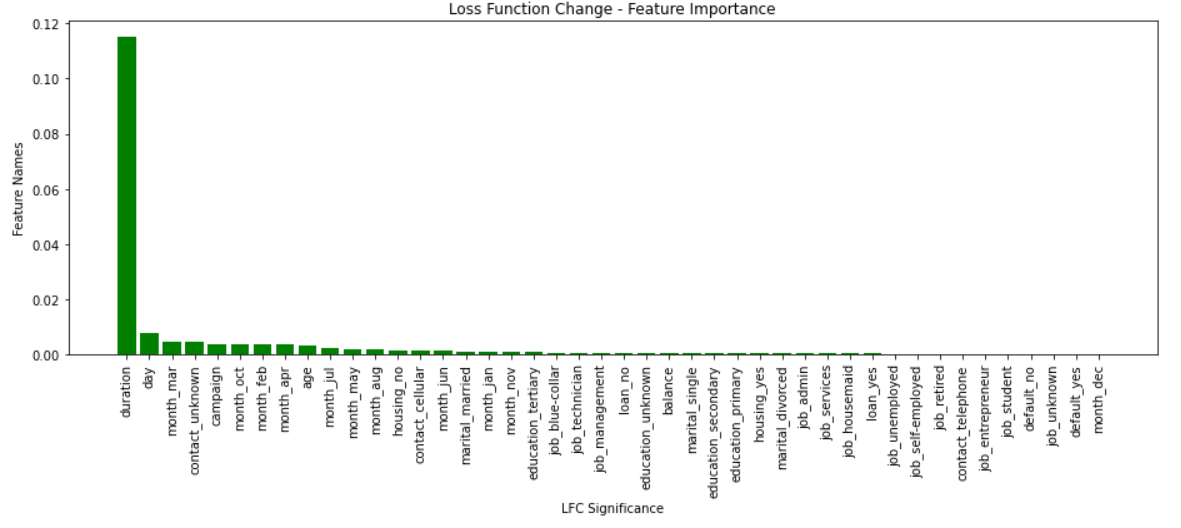
- Loss Function Change
Loss Function Change involves taking the difference between the metric (Loss function) obtained using the model in normal scenario (when we include the feature) and model without this feature. Higher the difference, the more important the feature is.
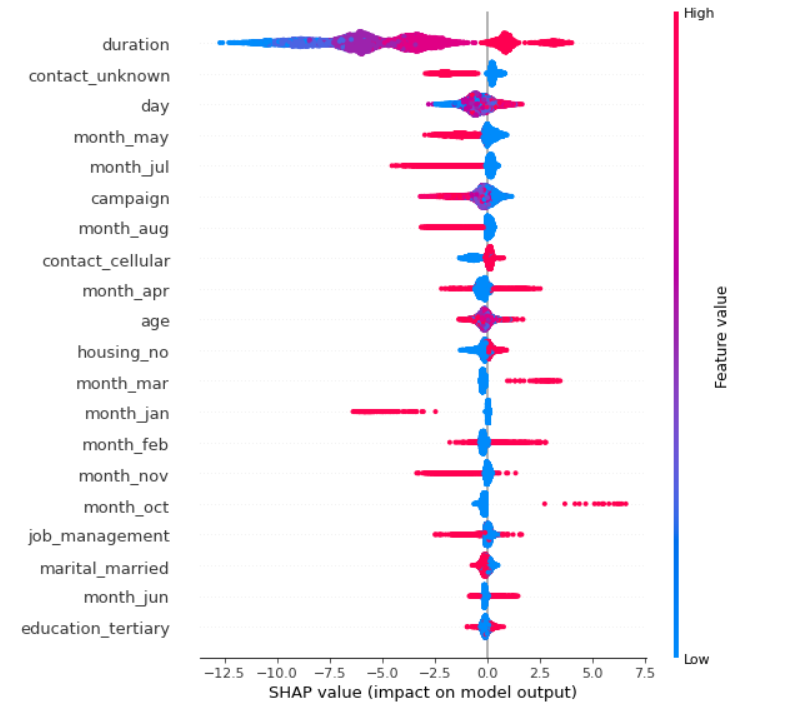
- SHAP (Shapley Additive Explanations)
SHAP Values break down a prediction to show the impact of each feature.
sum(SHAP values for all features) = single_prediction - prediction_for_baseline_values
- Permutation Feature Importance
Importance is measured by calculating the increase in model's prediction error after permuting the feature. A feature is "important" if shuffling its values increases the model error (because in this case the model relied on the feature for the prediction). A feature is "unimportant" if shuffling its values leaves the model error unchanged (because in this case the model ignored the feature for the prediction)
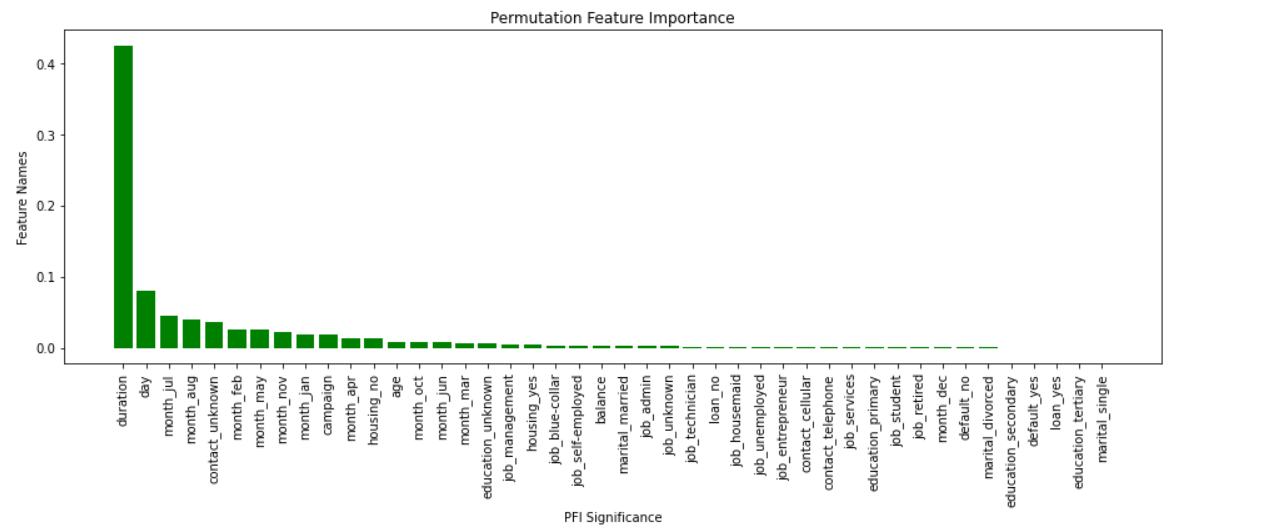
Significance of Features based on the above and coeffiecent values:
Duration: Duration since last contact seems to have the highest significane with respect to the subscription. Larger the duration more likely the customer is to make a subscription. (This seems like an unusual inference)
Balance: Balance has a positive relation with subscription. It makes sense to target consumers that have a high average yearly balance.
Age: In general a younger demographic is more likey to make the subscription.
Day: People are more likey to subscribe to the deposit when contacted on days later in the month.
Month: (Unusual) Contacting people in the following months have had the most success: October, March Contacting people in the following months have had the least success: January, August, July
Education: People with higher levels of education are more likely to make the financial investment
Job: This is relatively not too sigificant a feature. People with the following jobs are more likely to make subscriptions: Retired, Students, Technician, Admin People with the following jobs are unlikey to make subscriptions: Housemaids, Entrepreneurs, Self-Employed
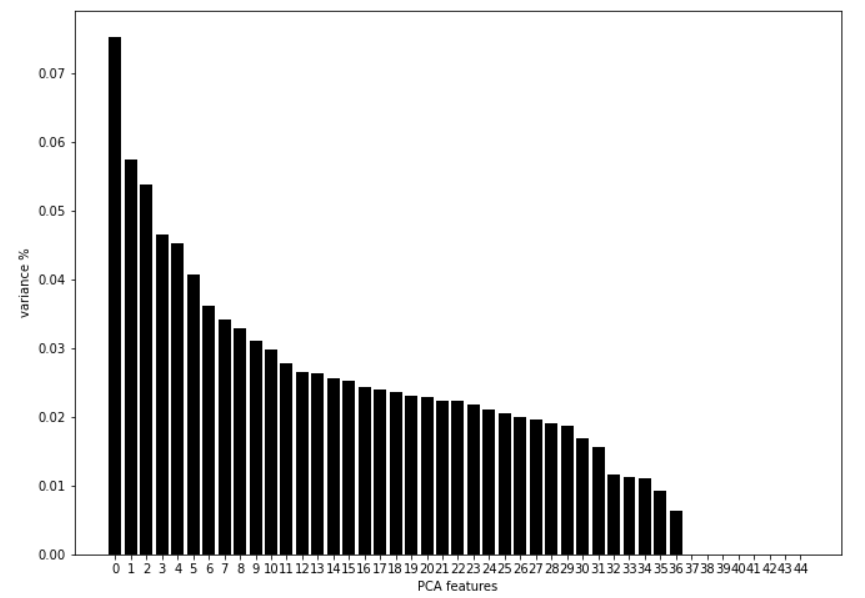
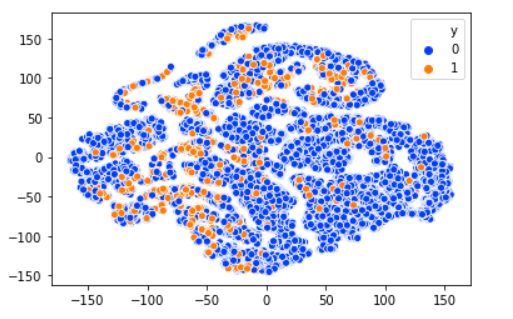
Post encoding the features we have in total 45 features so we have used PCA and TSNE for dimensionality reduction
PCA plot of features by variance
TSNE
- Reassess dimensionality reduction
- Customer segmentation via clustering to identify key customer groups to target market the term deposit