


Primary Links:
- ⚙️ Main Engine Repository: squid-protocol/gitgalaxy
- 🗺️ Live WebGL Architecture Map: squid-protocol.github.io/gitgalaxy/
This repository serves as the centralized, automated data warehouse and visualization pipeline for GitGalaxy. Because the core GitGalaxy engine operates as a zero-trust, air-gapped static analyzer, it does not "phone home" or collect telemetry on the machines running it.
Instead, this repository passively aggregates our public distribution metrics—tracking how often the engine is fetched across GitHub, GitLab, and PyPI.
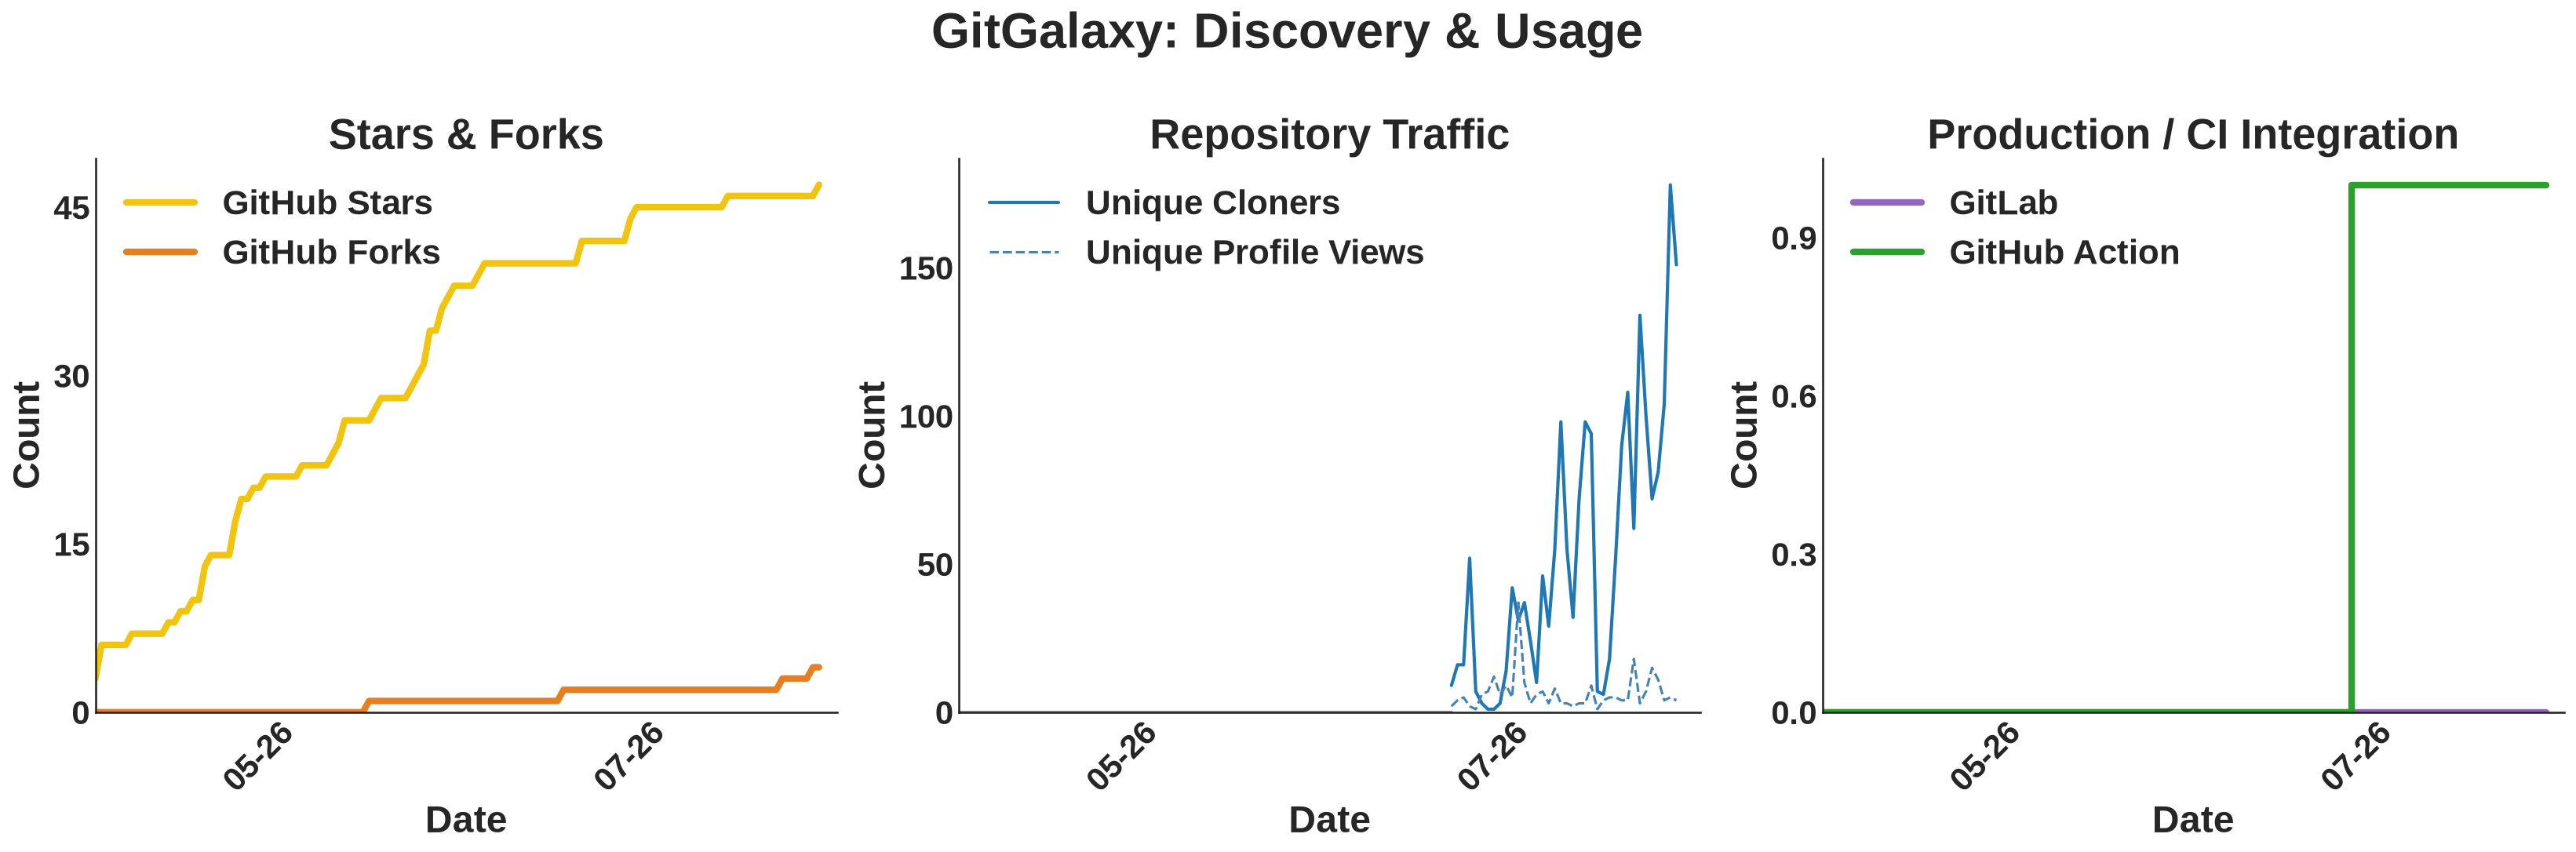
GitGalaxy is meant to run in CI, not just get starred and forgotten — so instead of treating CI-driven traffic as noise to filter out, we track it as its own adoption signal, side by side with human discovery. Left panel: GitHub stars and forks (cumulative, reconstructed from each star's/fork's own timestamp — not just a snapshot going forward, see Methodology) alongside daily unique cloners and profile views. Right panel: GitLab CI/CD Catalog usage (unique projects running it in a pipeline in the last 30 days) and GitHub Action adoption (unique repos referencing uses: squid-protocol/gitgalaxy in a workflow, via code search — there's no Marketplace listing yet, so this is the best passive proxy available). Unlike the left panel, neither GitHub nor GitLab expose any history for these two, so expect the right panel to fill in day by day rather than show a backfilled trend.
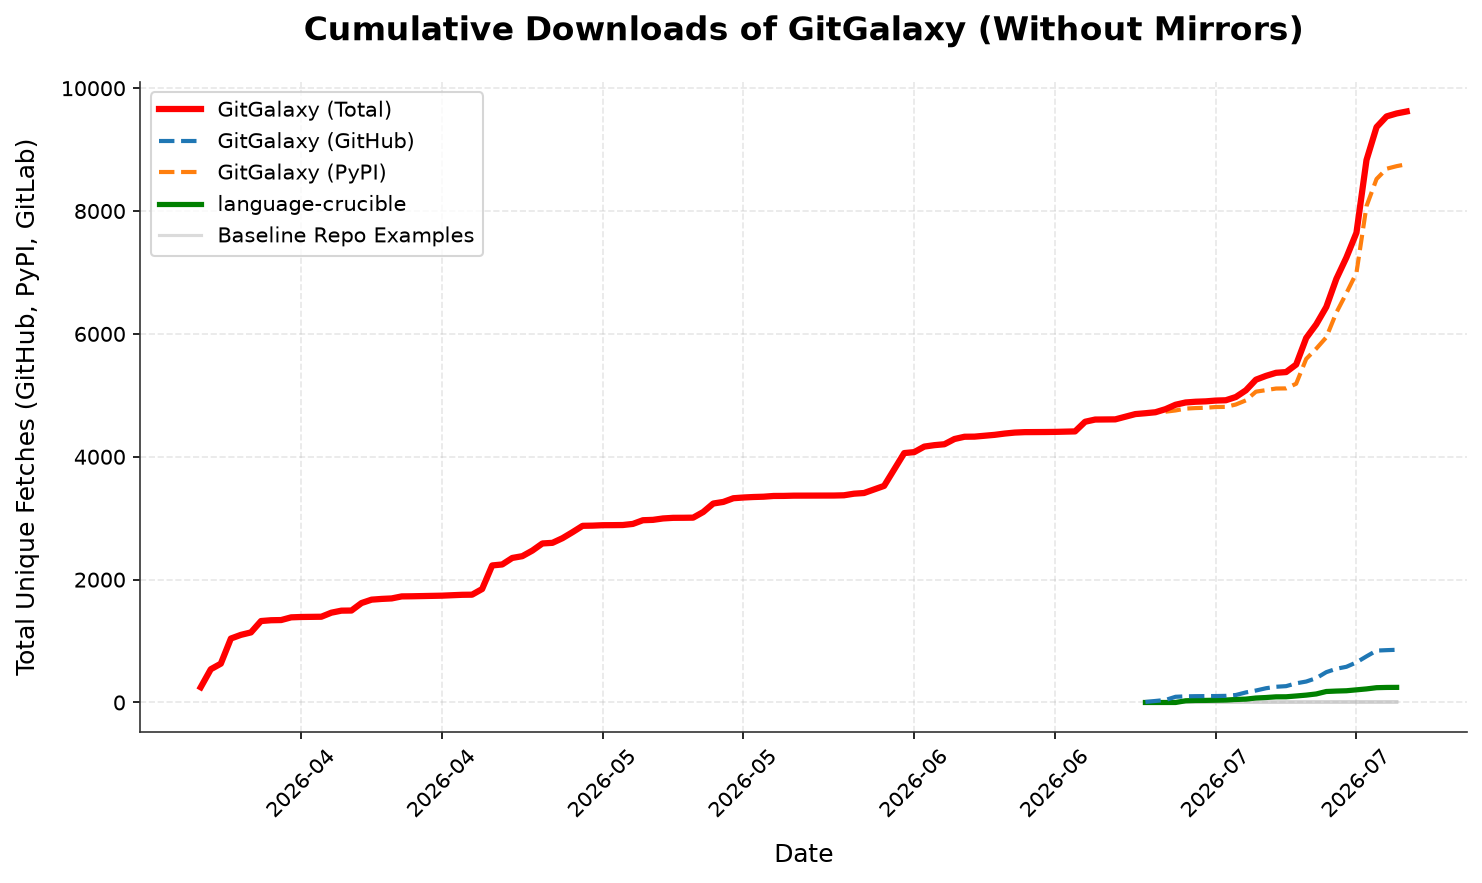
Tracking the combined volume of fetches across PyPI, GitHub, and GitLab against our baseline control repositories. Not a uniformly deduplicated count — GitHub's unique-cloner count and GitLab's unique-project count are genuinely deduplicated, but PyPI's public download data has no identity to deduplicate against, so that component is a raw download-event count (see Methodology below).
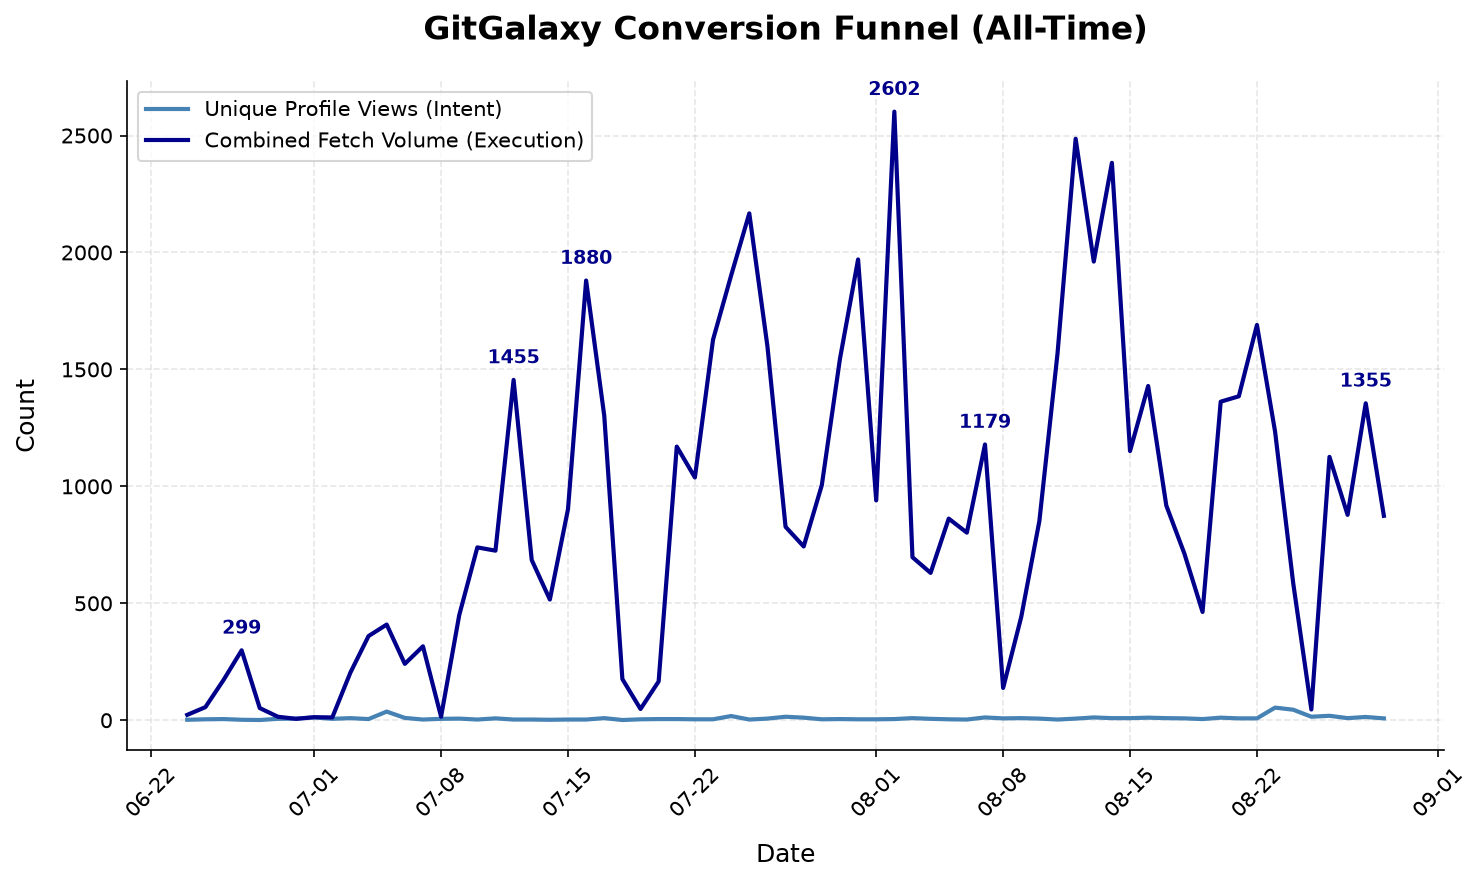
Measuring the transition from passive human intent (unique repository profile views) to active pipeline execution (unique automated fetches).
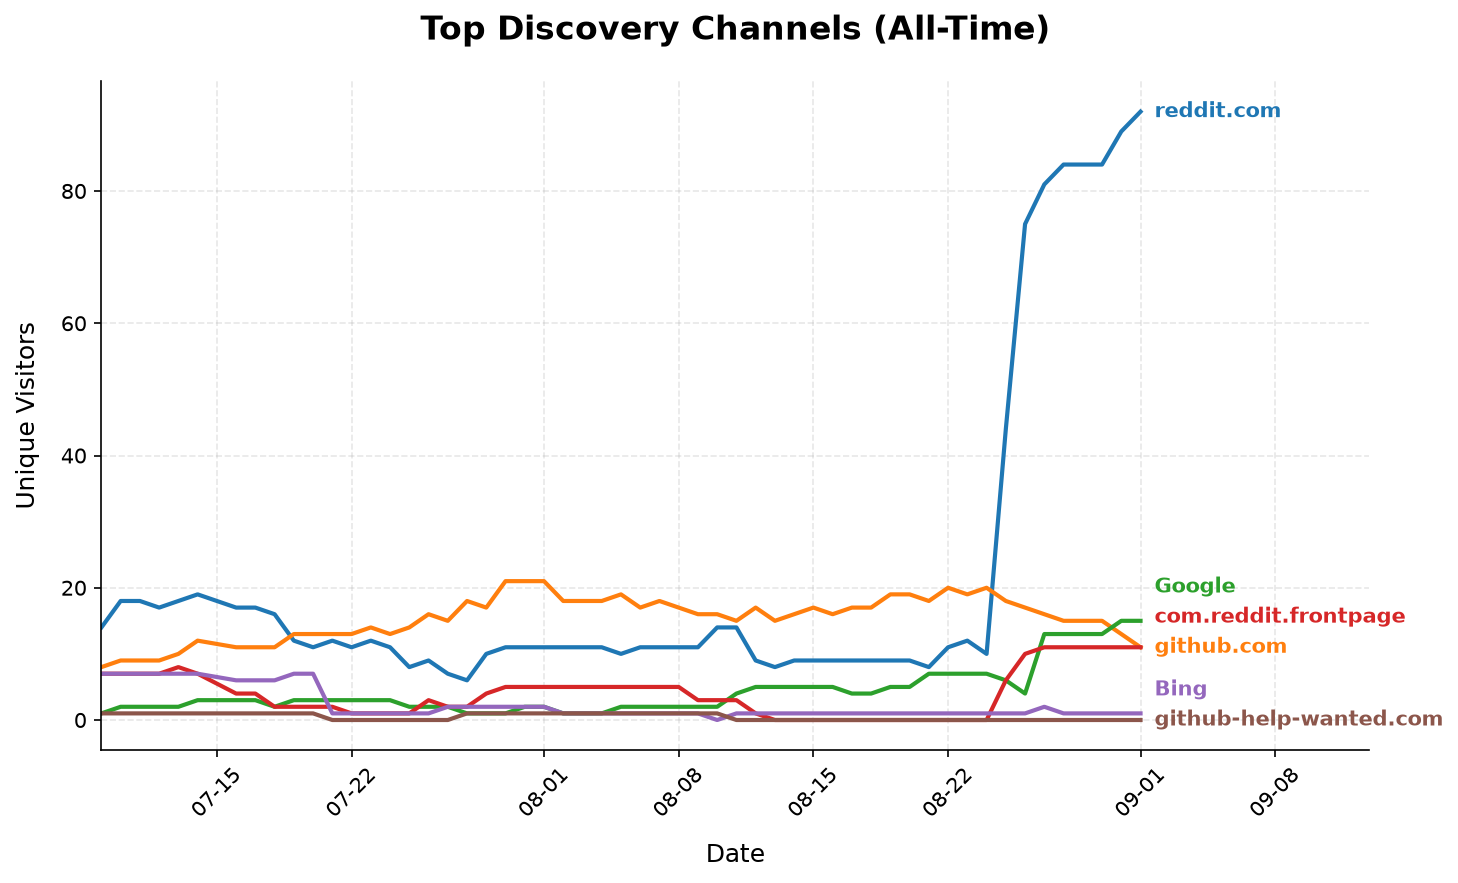
Identifying the top referring external domains driving initial human discovery of the GitGalaxy architecture.
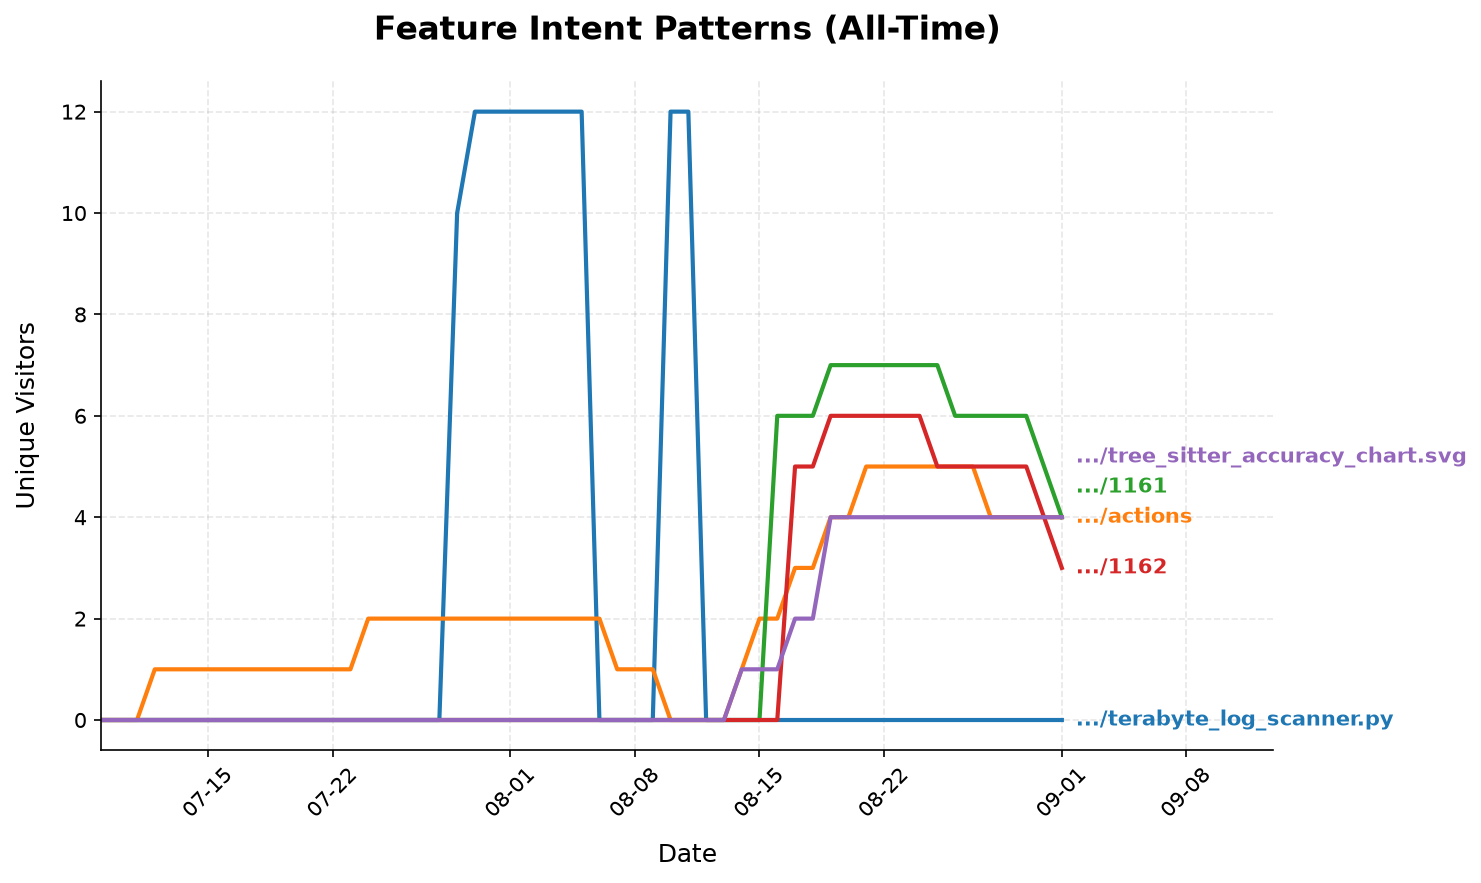
Mapping the most frequently inspected sub-directories and tools to understand what features users are auditing before pulling the engine.
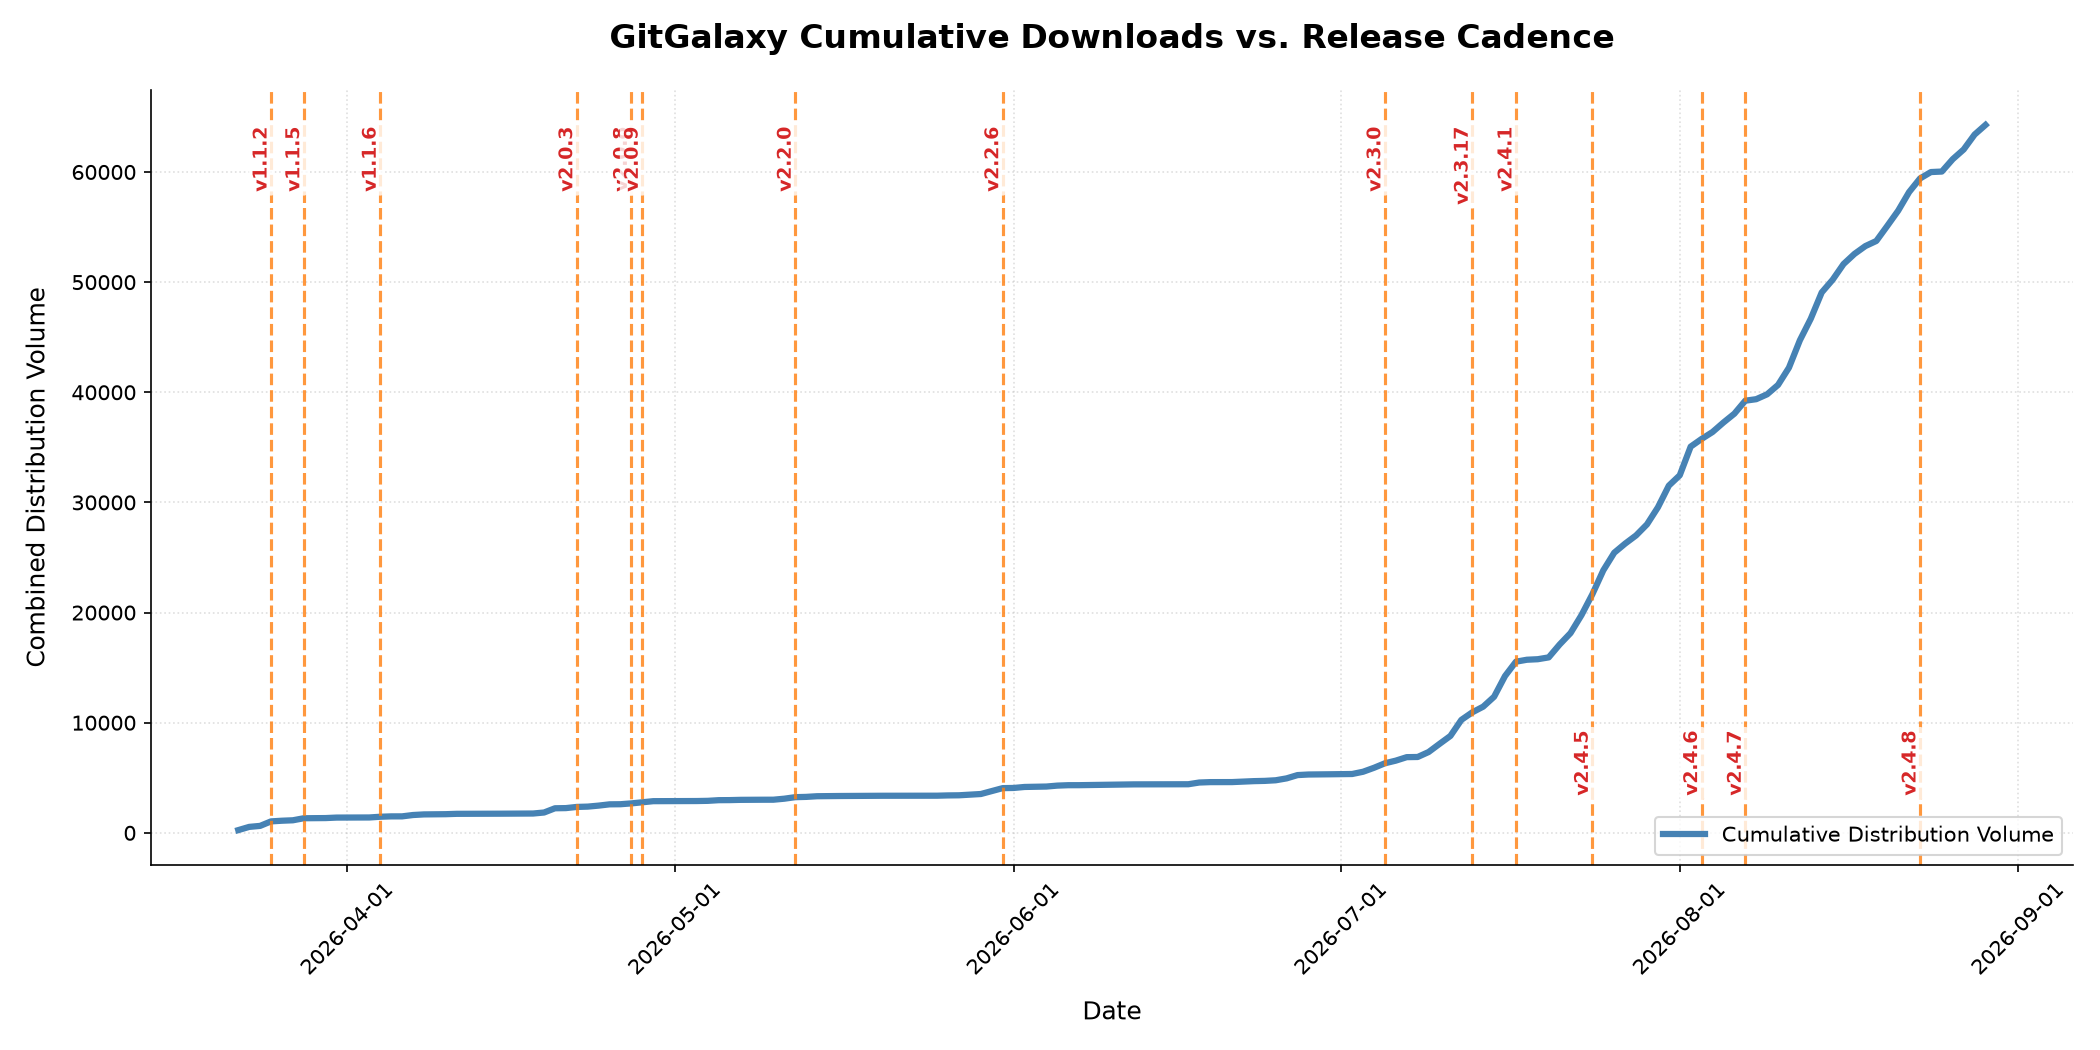
Correlating daily download spikes directly against version releases to monitor CI/CD Dependabot automated updates and community launch responses.
Graphs are generated automatically via Python/Matplotlib and synchronized daily via GitHub Actions.
Not every "count" below means the same thing — worth knowing when reading the charts:
| Source | What we store | Deduplicated? |
|---|---|---|
GitHub (traffic/clones, traffic/views) |
unique_cloners, unique_visitors |
Yes — GitHub's own 14-day rolling fingerprint window |
| GitLab CI/CD Catalog | last30DayUsageCount |
Yes — GitLab's docs define this as unique projects, not pipeline runs |
PyPI (pypistats.org, without_mirrors) |
raw download count | No. PyPI's public download data is anonymized by design — there's no identity to deduplicate against. without_mirrors only excludes known mirror-sync bots (e.g. bandersnatch); it does not exclude CI-driven installs (Dependabot, Actions test matrices, Docker builds all count fully). Treat PyPI's number as distribution volume, not unique adopters. |
| GitHub Action adoption (code search) | distinct repos matching "squid-protocol/gitgalaxy" under .github/workflows |
Approximate — deduped by repo, but code search only indexes each repo's default branch, and the query can't strictly anchor to uses: (GitHub code search tokenizes on punctuation), so it can slightly over-count. |
This is also why "Cumulative Adoption" is labeled distribution volume, not "unique fetches" — only two of its three inputs are actually unique counts.
This repository is completely self-contained and runs on an automated daily CRON schedule via GitHub Actions.
- The Scraper (
scraper.py): At UTC Midnight, the pipeline reaches out to the GitHub REST API (traffic, repo stats, code search), GitLab GraphQL API, and PyPI Stats API to pull the sliding 14-day window of clones/views, point-in-time stars/forks, and downloads. - The Database (
traffic_metrics.db): The raw JSON responses are normalized and safely upserted into a highly relational SQLite database. - The Visualizer (
generate_graph.py): Pandas and Matplotlib query the SQLite database to calculate rolling windows and cumulative totals, rendering the time-series data into clean, professional PNG artifacts. (release_correlation.pyat the repo root is an earlier, standalone iteration of this file's release-correlation chart, kept for reference — it isn't invoked by the pipeline.) - The Commit (
telemetry_pipeline.yml): The CI/CD runner automatically commits the updated database and new image artifacts back to this repository, ensuring the dashboard remains perfectly synchronized without manual intervention.
This repo is one strand of the web of repos that build, prove, and showcase GitGalaxy. This one tracks how the engine spreads (fetches, views, referrers); the runtime evidence for what it does lives next door:
- gitgalaxy — the engine these metrics track
- squid-telemetry — you are here: public distribution/adoption analytics (the engine itself is air-gapped and phones nothing home)
- gitgalaxy-raw-output — unedited scan outputs + speed telemetry on hundreds of real repos
- language-crucible — the pinned adversarial corpus behind the engine's golden-master regression gate
- keyword-rosetta — one planted program in 46 languages, measuring cross-language measurement consistency
- gitgalaxy-population-analyses — statistical analyses over the scan population
- cobol_to_java_examples — 10 COBOL repos auto-translated to compiling Spring Boot architectures
- Docs: architecture & methodology site · Museum of Code · gitgalaxy.io · PyPI · demo video