This repository contains the infrastructure automation scripts and Kubernetes manifests required to deploy and evaluate a 5G Service Function Chain (SFC) across simulated Cloud and Edge environments.
This project explores the performance implications of ETSI MANO orchestration by benchmarking a traditional Cloud environment (Minikube/Docker) against a resource-constrained Multi-Access Edge Computing (MEC) node (K3s/containerd).
The architecture emulates a Zero-Trust 5G Network Slice using lightweight, container-native proxies. It consists of three sequentially deployed Virtualised Network Functions (VNFs):
- VNF 1 (Edge Security Firewall): An NGINX proxy providing Layer 4/7 admission control at the network boundary.
- VNF 2 (DPI / IDS Emulator): An NGINX node simulating Lawful Interception by actively unboxing, inspecting, and injecting security headers (
X-DPI-Inspected) into HTTP payloads. - VNF 3 (MEC UPF Gateway): A high-concurrency HAProxy acting as the User Plane Function (UPF) to load-balance traffic to target applications.
By comparing the deployment of this SFC on both a heavy Cloud orchestrator and a lightweight Edge orchestrator, this project empirically evaluates TCP throughput, HTTP latency, and container runtime efficiency.
This diagram illustrates the theoretical ETSI MANO layers mapped to the project's practical Azure and Kubernetes infrastructure.
graph TD
    %% Define Styles for ETSI Layers
    classDef orchestrator fill:#f9f,stroke:#333,stroke-width:2s,color:black;
    classDef vnflayer fill:#bbf,stroke:#333,stroke-width:1s,color:black;
    classDef nfvi fill:#ddd,stroke:#333,stroke-width:1s,stroke-dasharray: 5 5,color:black;
    classDef tooling fill:#fff,stroke:#333,stroke-width:1s,color:black;

    subgraph User_Layer [User/Admin Layer]
        Tooling(Personal/Lab Machine<br/>Bash Provisioners & SSH)
        Manifest(Declarative YAML Manifest<br/>5g-service-chain.yaml)
    end

    subgraph MANO_Orchestrator [ETSI MANO Orchestrator]
        K8sMaster(Kubernetes Control Plane<br/>kube-apiserver / kube-scheduler)
    end

    subgraph VNF_Layer [Virtualised Network Function Layer]
        VNF1(VNF 1: Edge Firewall<br/>Pod: NGINX Alpine)
        VNF2(VNF 2: DPI/IDS Emulator<br/>Pod: NGINX Alpine)
        VNF3(VNF 3: MEC UPF Gateway<br/>Pod: HAProxy Alpine)
    end

    subgraph NFVI [NFVI: Azure Infrastructure]
        VM_Host(Azure Ubuntu VM<br/>Capped Hardware Profile)
        subgraph Runtime [Container Runtime Engine]
            CRE(containerd / Docker Daemon)
        end
    end

    %% Define Relationships
    Tooling ==>|apply IaC| Manifest
    Manifest ==>|kubectl apply| K8sMaster
    K8sMaster ==>|declarative intent| NFVI
    CRE ==>|instantiates| VNF1
    CRE ==>|instantiates| VNF2
    CRE ==>|instantiates| VNF3
    VM_Host --- CRE

    %% Assign Classes to Nodes
    class Tooling tooling;
    class K8sMaster orchestrator;
    class VNF1,VNF2,VNF3 vnflayer;
    class VM_Host,CRE nfvi;
This diagram visualises the active data flow and traffic routing through the Virtualised Network Functions during experimental load testing.
flowchart TD
    %% Define Styles
    classDef user fill:#fff,stroke:#333,stroke-width:2s,color:black;
    classDef vnf fill:#bbf,stroke:#333,stroke-width:1s,color:black;
    classDef svc fill:#e1f5fe,stroke:#0277bd,stroke-width:1s,stroke-dasharray: 3 3,color:black;
    classDef target fill:#ddd,stroke:#333,stroke-width:1s,color:black;

    %% Components
    User(Test Client<br/>wrk / iperf3)

    subgraph K8s_Network [Kubernetes Cluster Networking]
        direction TD
        KubeProxy(kube-proxy<br/>iptables routing)

        subgraph VNF_1 [VNF 1]
            direction LR
            Svc1(Service: edge-firewall-svc<br/>Port 80 / 5201)
            Pod1(Pod: edge-firewall-vnf)
        end

        subgraph VNF_2 [VNF 2]
            direction LR
            Svc2(Service: dpi-inspector-svc<br/>Port 80 / 5201)
            Pod2(Pod: dpi-inspector-vnf)
        end

        subgraph VNF_3 [VNF 3]
            direction LR
            Svc3(Service: mec-gateway-svc<br/>Port 80 / 5201)
            Pod3(Pod: mec-gateway-vnf)
        end

        subgraph Target [Backend Applications]
            direction LR
            SvcT(Service: web-server-svc)
            PodT(Pod: target-servers)
        end
    end

    %% Data Flow (Data Plane)
    User ==>|1. Ingress| Svc1
    Svc1 -.->|2. Resolve| KubeProxy
    KubeProxy ==>|3. L4 Admission Control| Pod1
    Pod1 ==>|4. Forward| Svc2
    Svc2 ==>|5. L7 Deep Packet Inspection<br/>Header Modification| Pod2
    Pod2 ==>|6. Forward| Svc3
    Svc3 ==>|7. L7 UPF Traffic Engineering| Pod3
    Pod3 ==>|8. Egress| SvcT
    SvcT ==> PodT

    %% Assign Classes
    class User user;
    class KubeProxy svc;
    class Svc1,Svc2,Svc3,SvcT svc;
    class Pod1,Pod2,Pod3 vnf;
    class PodT target;
The files in this repository are designed to be distributed across your local machine and the respective Azure Virtual Machines.
These files remain on your local machine to manage remote access and version control:
connect.sh: An interactive SSH manager with environment variable loading..env: Template for SSH configurations (IPs, Usernames, Passwords).
These files must be copied to the Cloud Server VM (Ubuntu 22.04 LTS):
bootstrap-cloud.sh: The master orchestration script to install Minikube, Docker, Prometheus, Grafana, and deploy the SFC.5g-service-chain.yaml: The declarative Kubernetes manifest defining the VNFs.
These files must be copied to the Edge Client VM (Ubuntu 22.04 LTS):
bootstrap-edge.sh: The master orchestration script to install K3s, Node Exporter, and deploy the SFC.5g-service-chain.yaml: The identical Kubernetes manifest for a 1:1 performance comparison.
(Note: .pem SSH keys and local .env files are strictly ignored via .gitignore for security).
Before running the scripts, you must manually provision two Virtual Machines in Microsoft Azure:
- Cloud VM: Standard_B2s (2 vCPUs, 4 GiB memory).
- Edge VM: Standard_B1s (1 vCPU, 1 GiB memory) to simulate a constrained IoT/MEC device (e.g., Raspberry Pi) or Standard_B2s if unavailable.
Network Security Group (NSG) Requirements: Ensure the following inbound port rules are configured on the VMs:
22(SSH) - Restricted to your current Public IP.80(HTTP) - Forwrkload testing.5201(TCP) - Foriperf3bandwidth testing.9090&3000(Cloud VM Only) - For Prometheus and Grafana Web UIs.9100(Edge VM Only) - To allow the Cloud Prometheus server to scrape Edge hardware metrics.
- Clone this repository to your local machine.
- Place your Azure
.pemkey files into the root directory. - Copy the environment template and fill in your specific Azure details:
AZURE_USER= CLOUD_VM_IP= CLOUD_KEY_FILE= EDGE_VM_IP= EDGE_KEY_FILE= GRAFANA_PASS= - Run the SSH manager to connect to your VMs:
./connect.sh
SSH into your respective VMs, copy and then execute the master scripts. The scripts feature interactive menus guiding you through Task B (Infrastructure Setup), Task C (Deployment), and Task D (Load Testing).
(Note: run the scripts as sudo to avoid any permission issues).
On the Cloud VM:
# Make executable
chmod +x bootstrap-cloud.sh
sudo ./bootstrap-cloud.sh
On the Edge VM:
# Make executable
chmod +x bootstrap-edge.sh
sudo ./bootstrap-edge.shOnce the environments are deployed (Option 05 in the scripts), utilise Option 06 to run the automated test suite. This uses kubectl run to generate ephemeral testing pods directly inside the clusters:
- ICMP Ping: Establishes baseline orchestration latency.
- iperf3: Floods the SFC with TCP packets to identify virtual network bandwidth ceilings.
- wrk: Simulates 100 concurrent HTTP users to evaluate Layer 7 Deep Packet Inspection overhead.
It should look like this:
Functional validations, such as Chaos Engineering (Pod assassination) and Negative Security (Unauthorised port blocking), are also integrated into the testing menu.
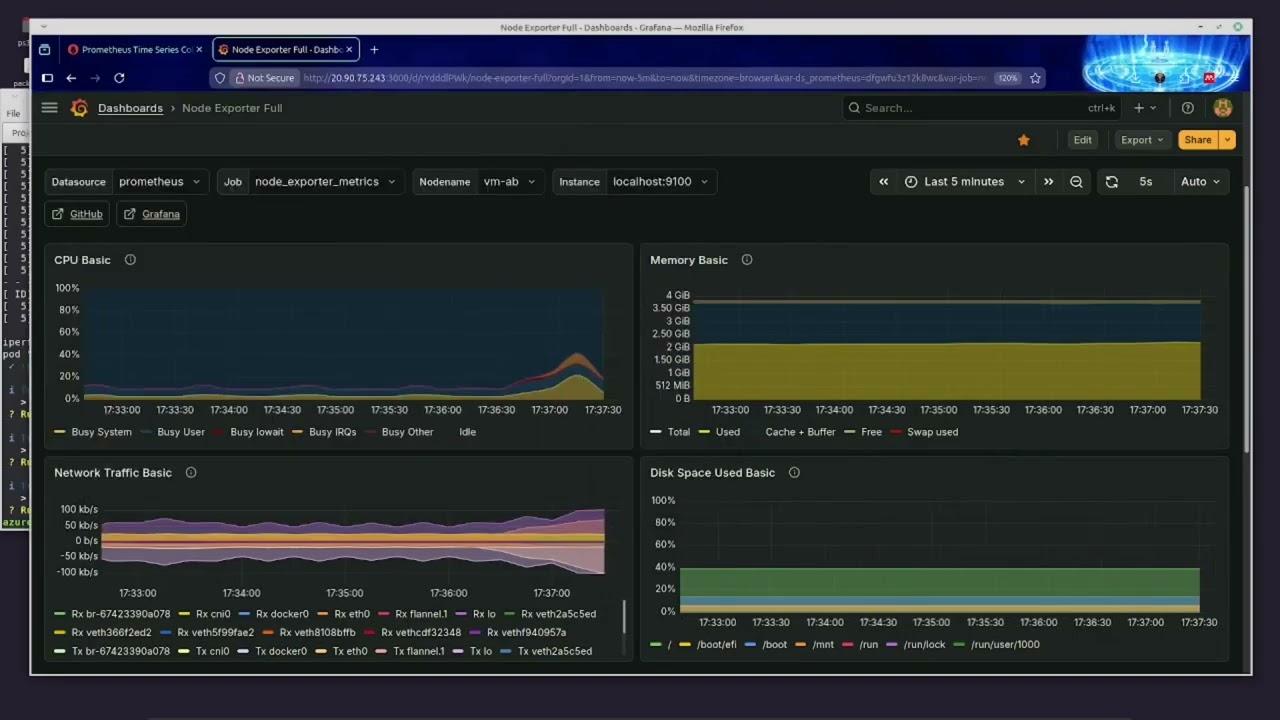
The orchestration scripts automatically provision a Hub and Spoke monitoring architecture to extract real-time hardware telemetry during the load tests.
- The Hub (Cloud VM): Hosts the Prometheus time-series database and the Grafana visualisation server.
- The Spoke (Edge VM): Runs a lightweight
node_exporterdaemon that allows the Cloud VM to remotely scrape its hardware metrics.
To view the dashboard:
- Ensure both environments are running via Option
05(up) in the bootstrap scripts. - On your local machine, run
./connect.shand select the Grafana option to securely open the web UI. - Import the official Node Exporter Full dashboard (ID:
1860).

Example: Grafana dashboard capturing Edge VM (K3s) telemetry during a 100-user
wrkload simulation. The distinct split in the CPU graph illustrates the division between kernel-level network routing (System) and application-level payload inspection (User), while Memory remains strictly static.