





A fast, machine-learning-based analyzer for multi-spectrum 2-D NMR Fragment Screening data.
Contents: Overview · Installation · How It Works · Getting Started · Usage Tips · Troubleshooting · Background · Citation · Changelog · License
CSP-Analyzer automates analysis of two-dimensional NMR spectra in fragment-based screening campaigns: a C# desktop frontend paired with a Python machine-learning backend, built to identify the most interesting fragment hits in large screening datasets fast.
It reads peak-picking data from Bruker TopSpin (peaklist.xml), treats each spectrum as a scatter-plot fingerprint, and compares every experiment spectrum against a reference spectrum. The comparison features feed a machine-learning pipeline (feature scaling → PCA → SVM classification) that labels each spectrum active or inactive.
Key features:
- Automated spectrum analysis — machine learning identifies active/inactive fragments
- Export to PDF and Excel for downstream analysis
- Interactive visualization of NMR spectra
- Integrated peak-picking guidance with TopSpin command-line helpers
Pre-built, self-contained packages are available for Linux, Windows, and macOS (x64) — no separate Python or .NET install required, the backend classifier is bundled inside.
- Go to Releases and download the zip for your OS from the latest release.
- Extract it anywhere.
- Run the executable directly from the extracted folder:
- Windows:
CspAnalyzer.Desktop.exe - Linux / macOS:
./CspAnalyzer.Desktop
- Windows:
Note: Don't move the executable out of its extracted folder — it expects
model_artifacts/andcsp-backend/to stay right next to it.
Building from source instead requires the .NET 8 SDK and a csp_modern conda environment (see backend/requirements.txt) — see docs/superpowers/SESSIONS.md for the full development setup this project was built with.
The CSP-Analyzer pipeline runs in three stages:
- Data parsing — TopSpin-generated
peaklist.xmlfiles are parsed from the experiment folder structure. - Feature extraction — each experiment spectrum is compared against the reference spectrum to compute image-like comparison features.
- Classification — a trained machine-learning model processes those features through:
- Feature scaling: standardizes all features to zero mean and unit variance
- PCA: reduces dimensionality while preserving the most important variance in the data
- SVM: a scikit-learn support vector machine classifier predicts each spectrum as active or inactive
The backend ships as a self-contained executable bundled with the packaged app — no separate Python or conda install needed for end users (see Installation).
CSP-Analyzer expects experiments to follow the standard TopSpin folder structure:
<root>/
  <PROTEIN_NAME>/
    <EXP#>/
      pdata/
        1/
          peaklist.xml
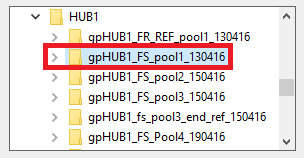
To load all selected experiments at once, select the folder at the <PROTEIN_NAME> level. CSP-Analyzer will recursively scan for all peaklist.xml files and process them in batch.
Try it first: every downloaded package includes a
Demo-dataset/folder next to the executable — loadDemo-dataset/gpHUB1_FR_REF_pool1_130416as the Reference andDemo-dataset/gpHUB1_FS_pool1_130416as the Dataset to try CSP-Analyzer immediately, no TopSpin data of your own required.
Use the PeakListExtractor companion application to retrieve peaklist.xml files generated after peak-picking in TopSpin. PeakListExtractor preserves the original folder-tree structure required by CSP-Analyzer for correct parsing.
Note: 1-D experiments are copied along but not analyzed by CSP-Analyzer.
Accurate peak-picking is critical for reliable CSP-Analyzer results. The in-app Help window provides an interactive command generator for TopSpin peak-picking.
Example TopSpin automatic peak-picking command for 2-D datasets:
1 F1P 135; 2 F1P 11; 1 F2P 102; 2 F2P 6; MI 0.03; PPNUM 120; pp2d nodia
Parameter meanings:
1 F1P/2 F1P: Upper-bound frequency limits for the 15N / 1H dimensions1 F2P/2 F2P: Lower-bound frequency limits for the 15N / 1H dimensionsMI: Minimum intensity contour limit for the lowest-intensity peak recognized as signal (not noise)PPNUM: Desired number of peaks — usually tied to the number of residues in the screened proteinpp2d nodia: Runs peak-picking silently, without showing the peak-picking windows
Finding the optimal settings sometimes requires running the same command several times to reach the best trade-off between correctly-picked peaks and background noise.
Rule of thumb: peak count should be no higher than 150 — the approach is reliable only when the peak count isn't too high and peaks aren't clustered too tightly. For proteins with more than 150 peaks, try tightening the
MIcontour to include only the highest-intensity peaks; this is a workaround that increases the risk of false negatives, but it should work.
The ML backend can be memory-hungry on large datasets. If it raises an out-of-memory exception, free up some RAM and restart the application.
Load the dataset files as described in the "Loading Experiments" section above and try again.
If you're running a downloaded package: don't move the executable out of
its extracted folder - the bundled backend (csp-backend/) and
model_artifacts/ must stay right next to it.
If you're running from source (a dev checkout, not a downloaded package):
this means no csp_modern conda environment was found. Install
Miniconda/Miniforge and create the env described in
backend/requirements.txt.
Usually caused by the Python backend running out of memory — free some memory and restart the application. If the backend ran successfully but you still get an error, the software may lack rights to write to the user's Temp folder — try rerunning with administrator rights.
This may be caused by incorrect or noisy peak picking. Refer to the Usage Tips section above to troubleshoot this issue.
Please report any other errors and we'll try to figure out what's going on. To help with bug reporting, you may also attach the JSON files generated during the analysis.
📄 CSP-Analyzer implements the method published in: Fino, R., Byrne, R., Softley, C.A., Sattler, M., Schneider, G. and Popowicz, G.M. (2020). Introducing the CSP Analyzer: A novel Machine Learning-based application for automated analysis of two-dimensional NMR spectra in NMR fragment-based screening. Computational and Structural Biotechnology Journal, 18, pp.603-611.



Fragment-based drug discovery relies on NMR screening to detect chemical shift perturbations (CSPs) that indicate protein-ligand binding, but manually reviewing hundreds of 2D spectra per campaign is slow and inconsistent — the same spectrum can get classified differently depending on where it falls in a long review session.
The approach: each 2D HSQC spectrum is reduced to a 15-element descriptor vector by comparing it against a reference spectrum using computer-vision techniques (histograms of oriented gradients, phase cross-correlation registration, ORB point-matching, structural similarity, Hu moments, MSE/PSNR, and Jensen-Shannon entropy). SMOTE-ENN balances the training classes, PCA reduces dimensionality, and an RBF-kernel SVM (with Platt scaling for calibrated probabilities) classifies each spectrum as active or inactive.
Validated on 1,611 2D HSQC spectra across 4 protein targets, trained on just 100 labeled spectra (6.2% of the total): 0.87 average accuracy, 0.72 sensitivity, 0.88 specificity, 3.10% false-negative rate, 10.30% false-positive rate — deliberately tuned to minimize missed actives over minimizing false alarms.
If you use CSP Analyzer in your work, please cite:
Fino, R., Byrne, R., Softley, C.A., Sattler, M., Schneider, G. and Popowicz, G.M., 2020. Introducing the CSP Analyzer: A novel Machine Learning-based application for automated analysis of two-dimensional NMR spectra in NMR fragment-based screening. Computational and Structural Biotechnology Journal, 18, pp.603-611.
Paper DOI: 10.1016/j.csbj.2020.02.015 · Open access full text: PMC7096735 · Publisher page: ScienceDirect
To cite the software itself (all versions), use the Zenodo concept DOI: 10.5281/zenodo.3618512.
BibTeX
@article{fino2020introducing,
  title   = {Introducing the {CSP} Analyzer: A novel Machine Learning-based application for automated analysis of two-dimensional {NMR} spectra in {NMR} fragment-based screening},
  author  = {Fino, Roberto and Byrne, Ryan and Softley, Claire A. and Sattler, Michael and Schneider, Gisbert and Popowicz, Grzegorz M.},
  journal = {Computational and Structural Biotechnology Journal},
  volume  = {18},
  pages   = {603--611},
  year    = {2020},
  publisher = {Elsevier},
  doi     = {10.1016/j.csbj.2020.02.015}
}CSP-Analyzer is distributed free of charge under the MIT License for both commercial and academic purposes.
See LICENSE file for full details. Third-party dependency licenses are listed in THIRD_PARTY_LICENSES.md.
- Roberto Fino — Frontend development, Python integration, Python testing, ML integration, Validaation (C#, Python) — LinkedIn
- Ryan Byrne — Backend development, Python ML pipeline design — LinkedIn

CSP-Analyzer was developed with support from the European Union's Horizon 2020 Research and Innovation Programme (2014–2020) under the Marie Sklodowska-Curie Grant Agreement No. 675555, funding the Accelerated Early staGe drug dIScovery (AEGIS) Innovative Training Network.
Learn more: www.aegis-itn.eu