


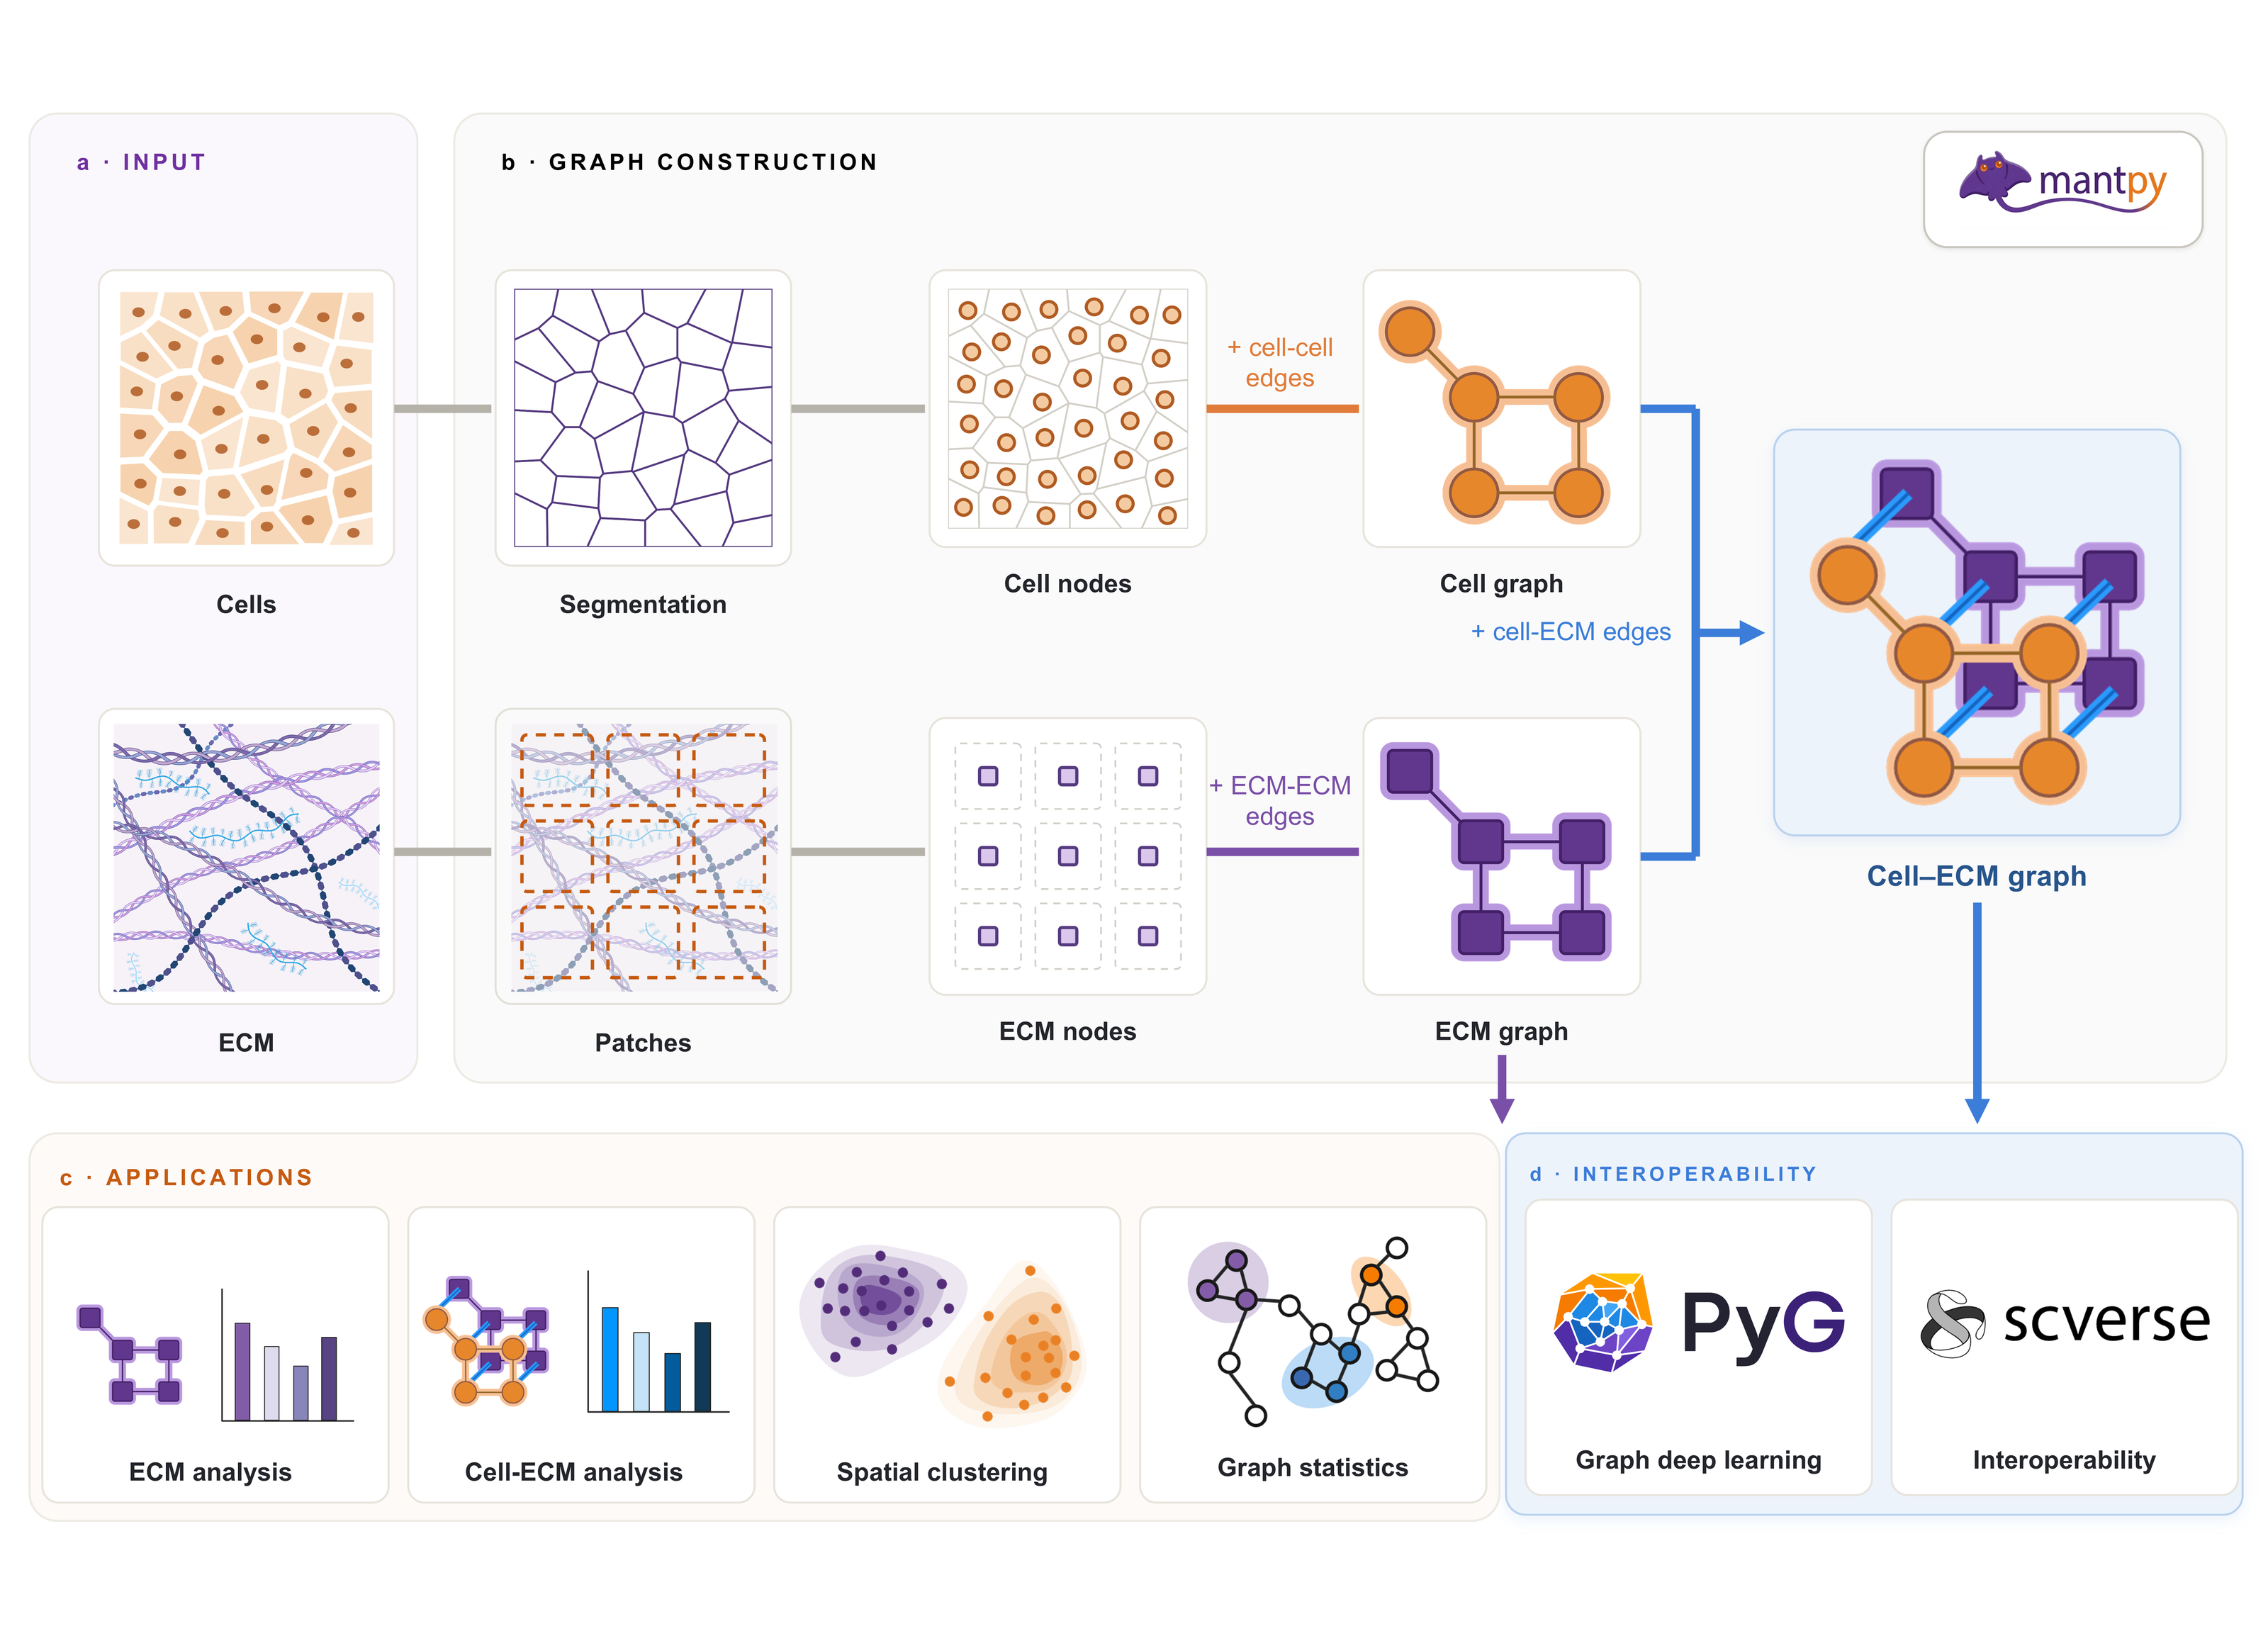
Mantpy is a scverse-based framework for graph analysis of the extracellular
matrix (ECM) in spatial proteomics. It represents cells and ECM patches as distinct,
linked node types, so matrix structure can be analysed on its own or together
with cellular context. Mantpy works with AnnData and interoperates with
Scanpy, Squidpy, and other single-cell and spatial tools.
Mantpy requires Python 3.11 or newer.
pip install mantpyOptional extras add heavier dependencies only when needed:
pip install "mantpy[gnn]"      # graph learning and explainability
pip install "mantpy[patch]"    # learned image-patch features
pip install "mantpy[spatial]"  # SpatialData integration
pip install "mantpy[segment]" # Cellpose segmentationThis runs as written — toy_ecm_roi synthesises a small region of interest in
memory, so there is nothing to download:
import mantpy as mt

# A small synthetic ROI: image stack, channel panel, cell table.
roi = mt.datasets.toy_ecm_roi()

# Read multiplexed imaging and a cell table into AnnData.
adata = mt.io.read_imc(
    roi.image, panel=roi.panel, cells=roi.cells,
    sample_id="toy", condition="ctrl",
)

# Normalise channels and segment the ECM into patch nodes.
mt.pp.normalize(adata)
mt.pp.extract_ecm_patches(
    adata,
    roi.image,
    ecm_channel="ColIV",
    ecm_K="auto",
    features=["mean"],
)

# Build cell, ECM, and joint cell-ECM graph layers.
mt.gr.build_graph(adata, mode="cell")
mt.gr.build_graph(adata, mode="ecm")
mt.gr.build_graph(adata, mode="cell_ecm")

# Quantify spatial organisation.
mt.tl.cell_ecm_enrichment(adata, cell_type="B")
mt.tl.neighbourhood_clustering(adata, n_clusters=4)

# Visualise results.
mt.pl.cell_ecm_graph(adata)
mt.pl.neighbourhood_clusters(adata)
Point mt.io.read_imc at your own files to run the same pipeline on real data:
adata = mt.io.read_imc("image.tiff", panel="panel.csv", cells="cells.csv")The toy ROI is synthetic — its clusters and statistics describe the generator, not biology. Use it to learn the API, then move to real data.
Step-by-step guides, each executed when the documentation is built:
- Loading data
- Building ECM graphs
- Cell–ECM graphs
- Exporting to AnnData
- Exporting to PyTorch Geometric
The full analyses behind the preprint run on real cohorts in the reproducibility repository; the intestine and lung workflows open directly in Colab.
One-line, checksummed loaders for every tutorial dataset, cached outside the package and reused offline:
intestine = mt.datasets.coliv_intestine()   #  93 MB
lung = mt.datasets.balbc_pbs_lung()         #  71 MB
liver = mt.datasets.schistosoma_ecm()       #  38 MB
Every loader returns the same Bunch shape as toy_ecm_roi, so moving an
example from synthetic to real data is a one-line change. The bundles are frozen
under CC BY 4.0 in an immutable
Zenodo record.
Documentation · API reference · Changelog
If you use Mantpy, please cite the preprint:
Ghafoor M, Parkinson JE, Pham T, Georgaka S, Haley MJ, Jokl E, Piper Hanley K, Allen JE, Sutherland TE, Rattray M. Mantpy: a framework for extracellular matrix analysis in spatial proteomics. bioRxiv (2026). doi: 10.1101/2025.06.04.657781
Machine-readable citation metadata is in
CITATION.cff
(GitHub's "Cite this repository" button). The tutorial datasets have their own
Zenodo DOI.
For questions and help requests, use the scverse discourse. To report a bug, use the issue tracker.