A full-featured Debug Adapter Protocol (DAP) client for Neovim.
ezdap brings an interactive debugger to Neovim: pause a program on a breakpoint, inspect variables and the call stack, and step through execution without leaving the editor. It implements the Debug Adapter Protocol directly, and can be used via any debugger implementing the DAP protocol.
- Easy to install: builtin DAP client and debugging UI.
- Full breakpoint support: line, conditional, hit-count, logpoints, column, function, exception (filters and named types) and data breakpoints / watchpoints.
- Tree-based debug panel: single side-panel window showing sessions, threads, call stacks, scopes, variables, watch expressions and breakpoints in one navigable view.
- Inline variable values: see values right in the source while stopped, in several placement styles (requires treesitter parser).
- Special buffers for each session: REPL, program output, adapter terminal.
- Advanced execution control: jump-to-cursor, restart frame, step-into-targets, exception info, disassembly view and instruction-level stepping.
- Parallel sessions: run several debuggees at once and switch between them.
- Project-scoped persistence: breakpoints and watch expressions are saved per project and restored automatically.
:checkhealth ezdap: verifies the Neovim version, setup and project state.
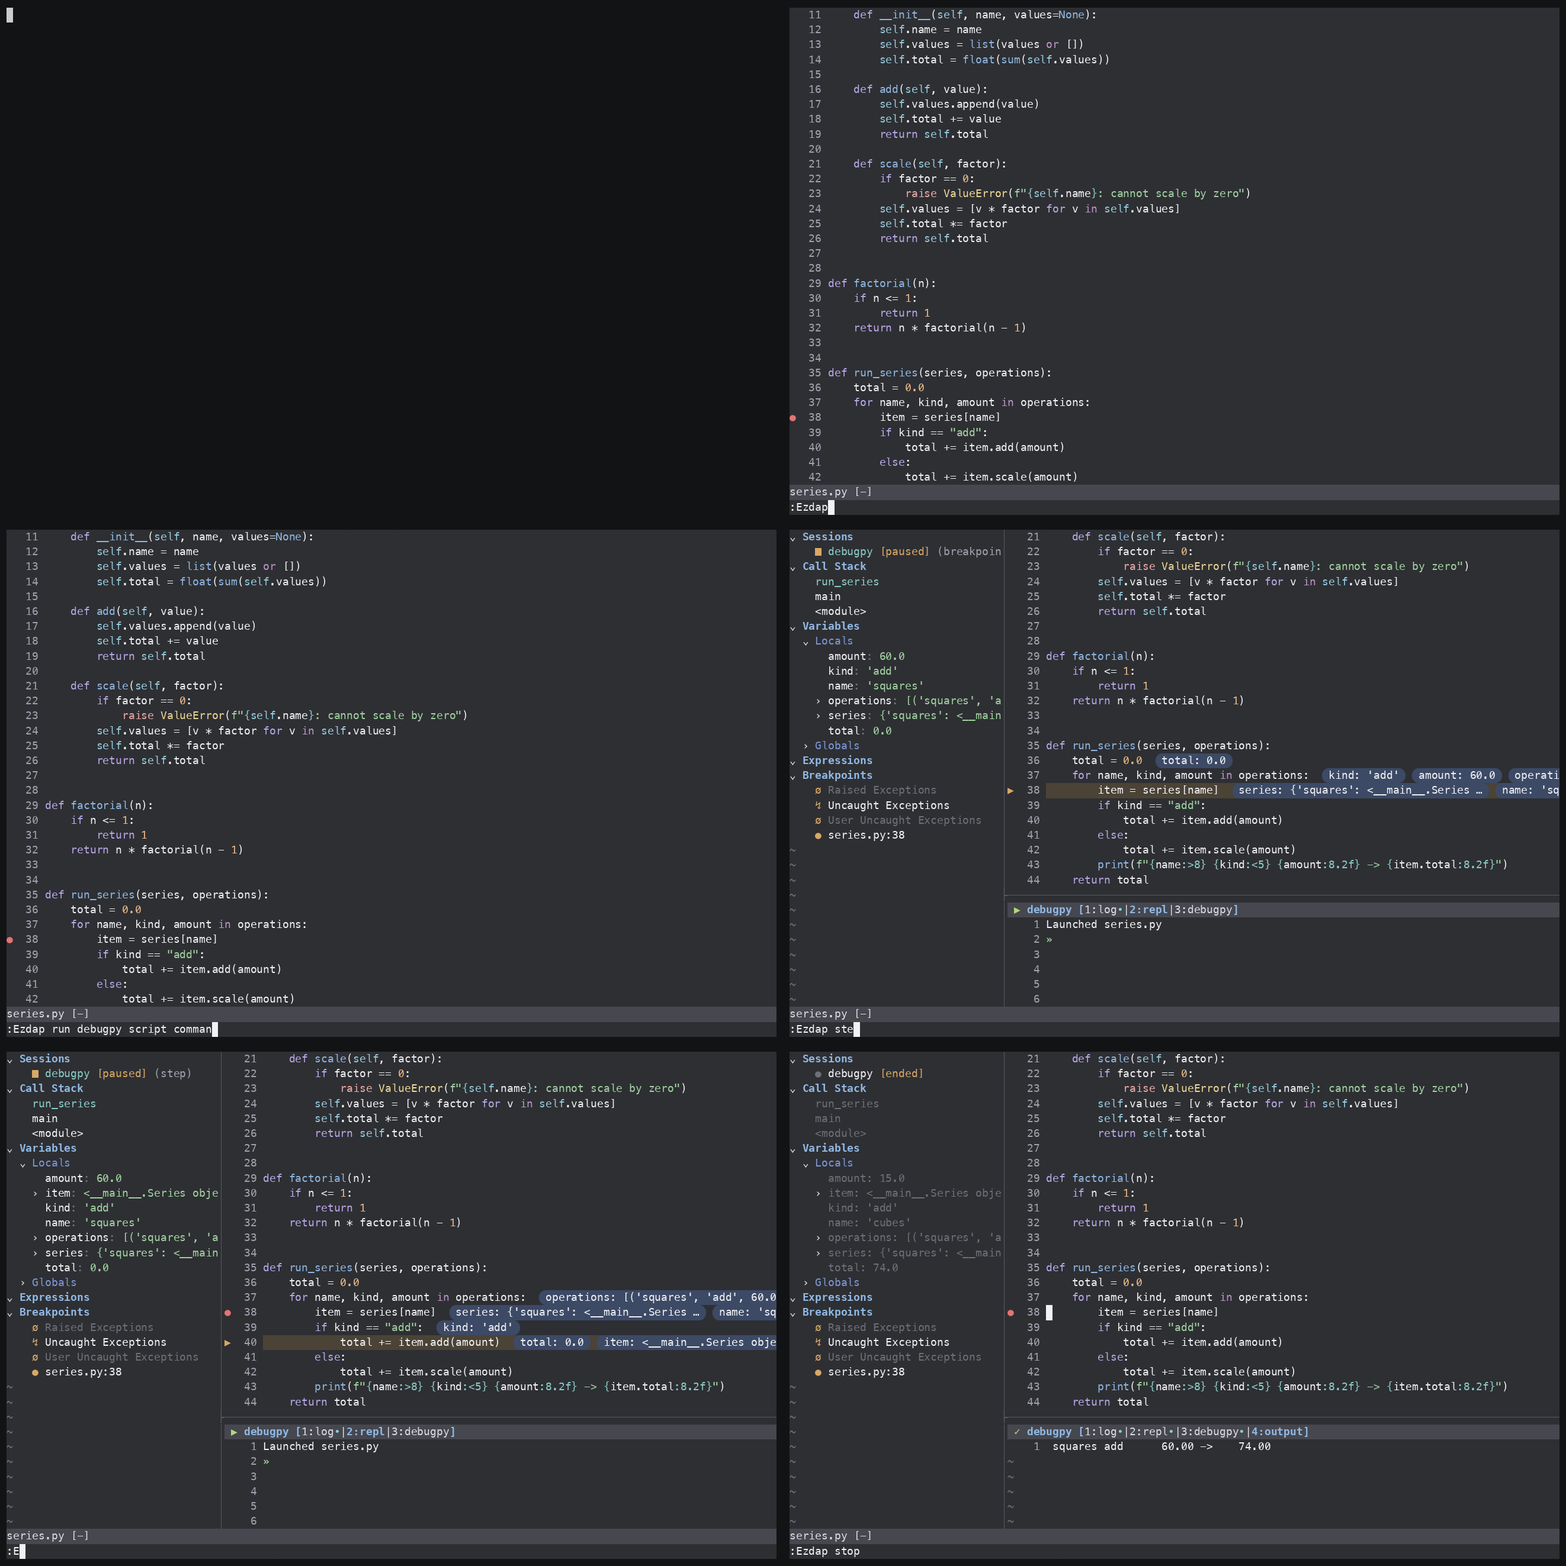
More demos → conditions and logpoints, exception breakpoints, the REPL, watch expressions, parallel sessions, persistence.
- Requirements
- Installation
- Quick start
- Adapters
- Starting a debug session
- Breakpoints
- The debug UI
- Stepping & execution control
- Configuration
- Command reference
- Persistence
- Health check
- Keymaps example
- Adding a custom adapter
- Writing an adapter definition
- Contributing
-
Neovim >= 0.10
-
A debug adapter for the target language (gdb, debugpy...). Many debug adapters can be installed via mason.nvim; although mason.nvim is not required
-
Optional: dock.nvim: if installed, ezdap routes the debug buffers (terminal, output, REPL) into dock's shared panel, one tab per run (see Output window). No configuration needed.
-
Install it with any plugin manager, then call
require("ezdap").setup()once from your config. Nothing is registered until you do. -
Install ezdap-adapters alongside it to register ready-made definitions for the common debuggers. This is the easiest way to start, and assumed by the examples below. OR Add a single adapter definition file (user provided or copied from ezdap-adapters) in the
ezdap-adapters/folder in the runtimepath (for example, in the configuration folder:~/.config/nvim/ezdap-adapters/)
Native packages / vim.pack
-- Neovim 0.12+
vim.pack.add({
  "https://github.com/mbfoss/ezdap.nvim",
  "https://github.com/mbfoss/ezdap-adapters",  -- ready-made adapter definitions
})

require("ezdap").setup({})                     -- required; pass options here
lazy.nvim
{
  "mbfoss/ezdap.nvim",
  dependencies = { "mbfoss/ezdap-adapters" },  -- ready-made adapter definitions
  opts = {},                                   -- required; passed to require("ezdap").setup()
}
setup() is the one thing you have to call: it applies your options, registers
the :Ezdap command (plus any command_alias) and installs the persistence
autocmds. setup({}) with no options is fine -- everything you leave out keeps
its default. Nothing beyond that is built until you actually debug: the first
:Ezdap invocation or API call brings the rest up, as does a project with
saved breakpoints to restore.
The main entry point is :Ezdap run, which launches (or attaches to) an
adapter using one of its named modes, filled in with a few input=value
arguments:
" Launch a native binary under codelldb
:Ezdap run codelldb binary command=./program\ argument

" Debug a Python file
:Ezdap run debugpy script command=./main.py\ argument

" Attach to a running process (opens process selector)
:Ezdap run codelldb attach
Set a breakpoint on the current line and step through the program:
:Ezdap breakpoint          " toggle a breakpoint at the cursor
:Ezdap continue            " run to the next breakpoint
:Ezdap step_over           " step over the current line
The debug panel opens automatically when a session starts, showing the call stack, variables and breakpoints. See The debug UI and Keymaps example for a convenient setup.
To debug a given language, ezdap needs an adapter definition: a description of how to reach that language's debug adapter.
Each adapter declares one or more named modes (binary, script,
attach, remote, …), each declaring the inputs it accepts.
An adapter definition is one ezdap-adapters/<name>.lua file on the runtimepath, keyed by its
filename stem.
The ezdap-adapters plugin provides ready-made definitions for some common debuggers. Installing it makes those adapters available for ezdap.
**Use :Ezdap adapter_info to inquire which modes an adapter has, and what inputs each mode takes.
:Ezdap adapter_info            " every available adapter, by name
:Ezdap adapter_info codelldb   " that adapter's modes and each mode's inputs
ezdap itself ships one adapter, remote, a generic TCP attach that connects
to a DAP server already listening on host:port, through its single connect
mode:
:Ezdap run remote connect host=127.0.0.1 port=4711A definition is read lazily on the first use (for example, via a
run, :Ezdap run <adapter> ...)
Listing do not load the adapter definitions (:Ezdap adapter_info, :checkhealth ezdap)
:Ezdap adapter_info <adapter> Loads and adapter configuration and reports it's supported modes and eventual configuration errors.
ezdap offers 2 main ways to start debug sessions.
:Ezdap run <adapter> <mode> [input=value ...]Arguments split on whitespace(:h <f-args>):
quotes are not special, and a value containing a space is written with a backslash
Example: :Ezdap run debugpy script command=./main.py\ --verbose cwd=/tmp/my\ project.
On the command line a list or map input is one token: entries separated by
commas, each entry KEY=VALUE for a map. Escape a comma inside an entry as
\,, and a space as \ :
:Ezdap run gdb binary command=./app env=RUST_LOG=debug,NO_COLOR=1
:Ezdap run codelldb binary command=./app args=--input\ my\ file.txt,--verbose
:Ezdap run codelldb binary command=./app args=--fields=a\,b,--verbose
Tab-completion offers adapters, then mode names, then the inputs
available for the chosen mode and, after an =, the values that
input can take: paths for the path-like ones, true/false for a boolean.
A run file is a Lua file that returns a table defining a debug session parameters.
It's the lua equivalent of the :Ezdap run ... command arguments.
Example:
-- debug.lua
return {
  name       = "debug app",    -- run label (defaults to "debug")
  adapter    = "codelldb",     -- an entry in require("ezdap.adapters")
  mode       = "binary",       -- one of the adapter's named modes
  parameters = {               -- answers to the mode's declared inputs
    command = "./build/app --verbose",
    cwd     = vim.fn.getcwd(),
  },
}
Use :Ezdap run_file <file/dir> to load and start a session from a run file.
:Ezdap run_file debug.lua
:Ezdap run_file ./debug/ " picker over the folder's run filesGenerate a ready-to-edit, mode-based run file from one of the adapter's modes. Required inputs are written active; every other input is listed commented out with its description, ready to be uncommented as needed:
:Ezdap new_run_file codelldb binary
" → writes <project root>/codelldb_launch.lua and opens it
Fill in the parameters, then :Ezdap run_file it. It resolves through the same
path as :Ezdap run.
Load an adapter's definition, check it, and show what it accepts, in a markdown
float rendered from the definition itself: a status section, giving where its
executable resolved to and anything wrong with the definition, left out entirely
when there is nothing to report, then a modes section with a subsection per
mode ; its request kind, its description, and a table of every input with its
type and what it means. Required inputs sort first and are marked [required] in
their description.
Everything above is available programmatically:
local ezdap = require("ezdap")

-- The run_mode / run_file / new_run_file / rerun entry points
ezdap.run_mode("debugpy", "script", { command = "./main.py" })
ezdap.run_file("debug.lua")
ezdap.rerun()

-- Adapters
ezdap.available_adapters() -- Available adapter names, (inlcuding unloaded).
                           -- Honours `enabled_adapters`.
local adapters = require("ezdap.adapters") -- loaded adaptersAll breakpoint operations are grouped under :Ezdap breakpoint <sub>. Breakpoints work
before a session starts and are synced live to running sessions.
:Ezdap breakpoint               " toggle a line breakpoint at the cursor
:Ezdap breakpoint toggle        " the same, spelled out
:Ezdap breakpoint set           " add a line breakpoint, never remove one
:Ezdap breakpoint condition     " condition + hit condition (prompts)
:Ezdap breakpoint logpoint      " logpoint (prompts for log message)
:Ezdap breakpoint set cond=x>3  " conditional breakpoint
:Ezdap breakpoint set col=here  " column bp at the word under the cursor
:Ezdap breakpoint set col=pick  " column breakpoint, pick a valid column
:Ezdap breakpoint fn <name>     " function breakpoint by name
:Ezdap breakpoint data          " watchpoint on a variable/expression
:Ezdap breakpoint list          " fuzzy-pick and jump to any breakpoint
:Ezdap breakpoint exception_filter              " toggle an adapter filter
:Ezdap breakpoint exception_type <name> [mode]  " named exception type
set is the non-interactive form: col= takes a column number, here (the word
under the cursor) or pick (choose among the columns the adapter reports as valid),
and cond=/hit=/log= write the condition, hit condition and log message. Values
are split by Vim's rules, so escape spaces (cond=x\ >\ 3), and an empty value
clears a field.
Every per-breakpoint subcommand (condition, logpoint, remove, the enable
state) acts on the breakpoint the cursor resolves to. A column breakpoint under
the cursor always wins; otherwise the editing subcommands assume the line
breakpoint, while remove asks, so a line carrying both never loses the wrong
one to a guess.
Enable/disable without removing, and clear in bulk:
:Ezdap breakpoint toggle_enabled  " enable/disable the one at the cursor
:Ezdap breakpoint disable_all
:Ezdap breakpoint clear_file      " remove every breakpoint in the file
:Ezdap breakpoint clear_all       " remove every breakpoint everywhere
clear_all removes all source, function and exception-type breakpoints across
every file. Adapter exception filters have no removed state, so they are turned
off instead.
Gutter signs distinguish each kind (verified or pending, conditional,
logpoint, disabled, exception). The full list of subcommands is in the
Command reference, and the glyphs are set with the
symbols option in Configuration.
The main panel is a tree of sessions → threads → stack frames → scopes →
variables, plus watch expressions and breakpoints. It opens
automatically when a session starts; open or focus it any time with
:Ezdap (or :Ezdap view). :Ezdap view hide closes it, and
:Ezdap view toggle does one or the other.
Inside the panel:
| Key | Action |
|---|---|
<CR> |
Expand/collapse, select a session, switch to a frame, or jump to a breakpoint's source |
K |
Show the full value / frame details / exception info / breakpoint details |
i |
Add a watch expression, a function breakpoint, or a data breakpoint (on a variable) |
d |
Remove the watch expression or breakpoint under the cursor |
r |
Rename the watch expression under the cursor |
x |
Toggle the breakpoint under the cursor enabled/disabled |
c |
Change a value / breakpoint condition / exception break mode / data access type |
g? |
Show this keymap cheatsheet |
zo zc za zO zC |
Fold controls (expand / collapse / toggle / all) |
A run spawns several buffers: Terminal, Output, REPL, its progress Log, DAP
messages. They share one bottom split, which holds whichever of them has the
highest priority (the Terminal takes precedence over the Output, which takes
precedence over the REPL, which takes precedence over the Log). It opens on the run's first buffer, follows along as
higher-priority buffers appear or the shown one is deleted, and closes with the
run's last buffer. :Ezdap output toggles it; panel_auto_open and
panel_height_ratio adjust it.
Each run keeps its own log, ezdap://<run>-log, wiped with the run, rather
than appending to a shared one, so parallel runs never interleave.
With dock.nvim installed, ezdap uses it
instead, with no configuration needed. Each run becomes a tab in dock's shared panel,
one page per buffer, labelled with the run's state; parallel runs each get a tab
rather than sharing one window, and :Dock clean removes the finished ones.
dock's own options (auto_open, size, position) govern the window there, so
panel_auto_open/panel_height_ratio do not apply.
While stopped, ezdap renders variable values inline in the source. Choose the
placement with the inline_vars option (inline, eol, eol_right_align,
right_align, or off). See Configuration.
A run's buffers are listed under its session row in the debug view; <CR> on one
opens it in a regular window:
- REPL: Debugger interactive console
- Output: the debuggee's output
- Terminal: when the adapter launches the debuggee in a terminal
Adapters that offer an external console (console = externalTerminal,
codelldb's terminal = external) launch the debuggee in a terminal emulator of
its own instead, chosen by the external_terminal option; see
Configuration. If that option is unset or the emulator cannot be
spawned, the request fails rather than falling back to an integrated terminal.
:Ezdap clean " drop finished runs and wipe their buffers:Ezdap inspect " hover the word under the cursor (or, in visual
" mode, the selected expression)
:Ezdap value " same target, but shows the full value straight
" away instead of the expandable tree
:Ezdap disassemble " open the disassembly view for the current frame
:Ezdap exception_info " details of the exception at the current stopIn the disassembly view, <CR> opens the corresponding source line and K
shows the instruction reference. Breakpoints and stepping become
instruction-level while it is focused.
While a session is live, ezdap adds a Debug Inspect entry to the right-click
menu, which inspects the word clicked on (or the selection, in visual mode). It
appears with the first session and is removed with the last, so the stock menu
is untouched when nothing is being debugged. Set popup_menu = false in
Configuration to leave the menu alone entirely.
The entry needs a GUI or a terminal with mouse support.
:Ezdap continue         " continue the active session
:Ezdap continue_all     " continue every session
:Ezdap step_over        " (alias: :Ezdap next)
:Ezdap step_in
:Ezdap step_out
:Ezdap step_into_targets" pick which call on the line to step into
:Ezdap step_back        " reverse debugging (adapter permitting)
:Ezdap reverse_continue
:Ezdap jump_to_cursor   " set the next statement to the cursor line
:Ezdap restart_frame    " restart the selected stack frame
:Ezdap pause
:Ezdap restart          " DAP restart request on the live session
:Ezdap stop             " stop the active session
:Ezdap stop_all         " stop every session
Stepping granularity follows the focused window: line-wise everywhere, and instruction-wise while the disassembly view is current.
Switch the active target with pickers:
:Ezdap session          " choose the active session
:Ezdap thread           " choose the active thread
:Ezdap frame " choose the active stack framePass options to setup(). Defaults when setup({}) is called are:
require("ezdap").setup({
  -- A second name to register `:Ezdap` under, sharing its handler and
  -- completion. Unset by default, so only `:Ezdap` exists.
  -- command_alias    = "Debug",
  -- Project detection: the nearest ancestor holding one of these is
  -- the root.
  root_markers        = { ".git" },
  -- Adapters to make available, by name. Unset (the default) leaves every
  -- registered adapter available; a list narrows the registry to exactly
  -- those names, hiding the rest from listing, completion and `:Ezdap run`.
  -- enabled_adapters = { "debugpy", "codelldb" },
  -- Per-project state file, written at the project root.
  data_filename       = ".ezdap.json",

  -- Max call-stack frames shown (extended when the frame is deeper).
  stack_trace_limit   = 10,
  -- Delay (ms) before clearing stale UI, to avoid flicker while stepping.
  antiflicker_delay   = 200,
  -- Max lines kept in Output / DAP-message buffers (0 = unlimited).
  output_max_lines    = 10000,
  -- Open the bottom output window as soon as a run registers a buffer.
  panel_auto_open = true,
  -- Height of the bottom output window, as a fraction of the editor.
  panel_height_ratio = 0.25,
  -- Width of the debug panel on first open, as a fraction of the
  -- editor's columns.
  debug_view_width_ratio = 0.2,
  -- Side the debug panel splits off on: "left" | "right".
  debug_view_position = "left",

  -- Inline value placement: "inline" | "eol" | "eol_right_align"
  -- | "right_align" | "off"
  inline_vars         = "eol",

  -- Log every DAP message to a "dap" buffer. For debugging ezdap or an
  -- adapter; leave off otherwise.
  raw_messages        = false,

  -- Terminal emulator (command + args) used when an adapter asks to
  -- run the debuggee in an external terminal; its command line is
  -- appended. Unset, an integrated terminal is used instead.
  -- E.g. { "alacritty", "-e" }.
  -- external_terminal = { "wezterm", "start", "--" },

  -- Add a "Debug Inspect" entry to the right-click menu while a session is
  -- live (see Right-click menu).
  popup_menu          = true,

  -- Glyphs for each debug state, in the gutter and in the panels alike.
  symbols = {
    debug_frame              = "▶",   -- current execution position
    active_breakpoint        = "●",   -- enabled + verified
    inactive_breakpoint      = "○",   -- enabled, not yet verified
    cond_breakpoint          = "■",   -- conditional, verified
    inactive_cond_breakpoint = "□",
    logpoint                 = "◆",
    inactive_logpoint        = "◇",
    disabled_breakpoint      = "ø",
    disabled_cond_breakpoint = "ø",
    disabled_logpoint        = "ø",
    exception_breakpoint     = "↯",
    unsupported_breakpoint   = "✗",
  },
})Everything is under the :Ezdap command, with completion for every subcommand.
Bare :Ezdap, with no subcommand, opens the debug panel. Set command_alias
in setup() to register it under a second name: an alias is the same command,
with the same subcommands and completion.
:Ezdap subcommands
| Subcommand | Description |
|---|---|
run … |
Launch/attach from input=value tokens |
run_file [path] |
Run a Lua run file, or pick from a directory |
new_run_file … |
Generate a run file from a mode's inputs |
adapter_info [adapter] [mode] |
Report an adapter's modes, inputs and tooling |
rerun |
Re-launch the most recent run |
(none) / view |
Open/focus the debug panel |
view toggle / view hide |
Close the panel if open / close it |
output |
Toggle the bottom output window |
continue / continue_all |
Continue the active / every session |
step_over (next) / step_in / step_out |
Stepping |
step_into_targets |
Pick a call target to step into |
step_back / reverse_continue |
Reverse debugging |
jump_to_cursor |
Set the next statement to the cursor line |
restart_frame |
Restart the selected stack frame |
exception_info |
Show details of the current exception |
pause / restart |
Pause / DAP-restart the session |
stop / stop_all |
Stop the active / every session |
session / thread / terminate_thread / frame |
Selection pickers |
inspect |
Hover a value (word under cursor or selection) |
value |
Same, showing the full value instead of the tree |
disassemble |
Open the disassembly view |
clean |
Drop finished runs and wipe their buffers |
project |
Report the resolved project root |
breakpoint … |
Breakpoint subcommands (below) |
:Ezdap breakpoint subcommands
| Subcommand | Description |
|---|---|
toggle (default) |
Toggle a line breakpoint at the cursor |
set [col=…] [cond=…] [hit=…] [log=…] |
Create or update a breakpoint; bare, a plain line breakpoint |
remove |
Remove the breakpoint at the cursor |
condition |
Set condition + hit condition |
logpoint |
Set/clear a log message (logpoint) |
enable / disable / toggle_enabled |
Per-breakpoint enable state |
enable_all / disable_all |
Bulk enable/disable |
clear_file / clear_fn |
Clear the current file / function breakpoints |
clear_all |
Clear all; disable exception filters |
fn [name] |
Toggle a function breakpoint |
exception_filter |
Toggle an adapter exception filter |
exception_type [name] [mode] |
Break on a named exception type |
data [name] |
Toggle a data breakpoint / watchpoint |
data_clear / data_list |
Manage data breakpoints |
list |
Fuzzy-pick and jump to a breakpoint |
Breakpoints and watch expressions are saved per project and restored
automatically. The project root is the nearest ancestor of the cwd containing a
root_markers entry (default .git); state is written to a single JSON file at
that root (.ezdap.json by default), using project-relative paths so it stays
portable.
State is saved on leaving a project (cwd change) and on exit, and reloaded on entering one. Outside any project, ezdap warns once that state will not be persisted. The current project is reported by:
:Ezdap projectConsider adding
.ezdap.jsonto the project's.gitignore, or commit it to share breakpoints across a team.
:checkhealth ezdapReports the Neovim version, whether the plugin is initialised, the resolved project state, and which adapters are available.
ezdap ships no global keymaps; any layout works. An example based on the function keys:
vim.keymap.set("n", "<F5>", "<Cmd>Debug continue<CR>", { desc = "Debug: continue" })
vim.keymap.set("n", "<F10>", "<Cmd>Debug step_over<CR>", { desc = "Debug: over" })
vim.keymap.set("n", "<F11>", "<Cmd>Debug step_in<CR>", { desc = "Debug: step in" })
vim.keymap.set("n", "<F12>", "<Cmd>Debug step_out<CR>", { desc = "Debug: step out" })
vim.keymap.set("n", "<F9>", "<Cmd>Debug breakpoint<CR>", { desc = "Debug: bp" })

vim.keymap.set("n", "<leader>dc", "<Cmd>Debug breakpoint condition<CR>", { desc = "Debug: conditional breakpoint" })
vim.keymap.set("n", "<leader>dl", "<Cmd>Debug breakpoint logpoint<CR>", { desc = "Debug: logpoint" })
vim.keymap.set("n", "<leader>dr", "<Cmd>Debug rerun<CR>", { desc = "Debug: re-run" })
vim.keymap.set("n", "<leader>du", "<Cmd>Debug view<CR>",  { desc = "Debug: focus view" })
vim.keymap.set("n", "<leader>dq", "<Cmd>Debug stop<CR>",  { desc = "Debug: stop" })

vim.keymap.set("n", "<leader>di", "<Cmd>Debug inspect<CR>", { desc = "Debug: inspect" })
vim.keymap.set("x", "<leader>di", "<Cmd>Debug inspect<CR>", { desc = "Debug: inspect" })For a debugger already covered by ezdap-adapters, install that plugin.
It's possible to copy one of the definition files provided in ezdap-adapters and copy it under
ezdap-adapters/ in the configuration folder.
More generally, a definition is a single Lua file under an ezdap-adapters/ directory anywhere
on the runtimepath, returning a table. It needs a way to reach the adapter (a command
to spawn or a host/port to connect to) and modes, each naming the inputs
it accepts and a build that turns them into the native DAP body:
A minimal example:
-- ~/.config/nvim/ezdap-adapters/myadapter.lua
---@type ezdap.AdapterDef
return {
  command = { "my-dap-adapter", "--stdio" },
  modes   = {
    binary = {
      description = "debug an executable",
      request     = "launch",
      inputs      = {
        program = { required = true, completion = "file", description = "executable to debug" },
      },
      build = function(inputs)
        return { program = require("ezdap.shared").normalize_path(inputs.program), stopOnEntry = true }
      end,
    },
  },
}
require("ezdap.adapters") is writable, so a definition can be registered by
hand from a config file (require("ezdap.adapters").myadapter = { … }) instead
of a file ; ezdap.available_adapters() lists those too, unless
enabled_adapters is set and leaves the name out, which withholds it from the
registry entirely.
The full contract is in WRITING-DEFINITIONS.md.
Added adapters are listed by :checkhealth ezdap and ezdap.available_adapters()
too, and document themselves:
:Ezdap adapter_info myadapter renders the modes and inputs declared above, and
reports whether the definition resolves and its command is present on this
machine, the same as for any shipped definition.
Why do modes declare inputs rather than taking a raw DAP body?
- Completion.
:Ezdap run lldb binary <Tab>lists that mode's inputs, andcommand=<Tab>completes paths because the input is declared path-like. - Validation before launch. Missing required inputs, a port outside
0–65535, or a malformed
A=1,B=2are reported during resolution, with the input named, instead of as adapter stderr. - Generated run files.
:Ezdap new_run_filewrites a run file frominputs, including each field's description, so no template can diverge from what the adapter accepts. - One value, two entry points. An input can be supplied on the command line
or in a run file (
envasA=1,B=2or as a table); both resolve through the same declaration into the samebuild. - Mode-supplied defaults. A mode can act on a missing input instead of omitting the field.
Contributions are welcome. See DEVELOPMENT.md for the architecture overview, module map, and conventions.