
🗒zgtools is a self-developed, highly integrated modular software suite containing over 200 functional modules, comprehensively covering various analysis tasks from conventional genomes to T2T genomes.
Its application scenarios include but are not limited to: Survey evaluation, assembly, Hi-C-assisted assembly, T2T complete assembly, gene annotation, evolutionary analysis, centromere prediction, and various customized analyses. Through a unified launcher interface, zgtools achieves efficient management of full-process analysis tasks, offering greater flexibility and customizability compared to Nextflow workflows.
🚀Leveraging practical experience from over 200 genome projects, zgtools has deeply optimized numerous standard analysis pipelines and implemented an automated update mechanism, striving to achieve the analytical goal of "faster, more accurate, and better."
🚩To date, zgtools has successfully completed T2T-level genome assemblies for more than 50 species, with related findings published in high-impact journals such as HR, PBJ, GB, and NC. For the vast majority of plants, mammals, and fish (including species with ZW/XY sex chromosomes), zgtools can effortlessly achieve complete T2T assembly and accurately resolve PAR (pseudoautosomal regions).
🚀In terms of efficiency, for genomes sized 300M–1G:
- The full Survey → Assembly → Hi-C pipeline takes only 3–7 days;
- The full T2T Assembly → Gap Filling → Telomere Extension & Repair → Evaluation pipeline takes only 7–14 days;
- The full RepeatAnno + ncRNA + DenovoAnno + TransAnno + HomoAnno + FuncAnno pipeline takes only 3–5 days.
Additionally, zgtools now offers comprehensive support for ultra-large genomes and autopolyploid T2T, covering T2T assembly and annotation. Its assembly metrics demonstrate outstanding performance:
⭐️Telomere-to-Telomere (T2T) metrics for a certain gymnosperm (genome size> 20Gbp) by【zgtools】:
- Sequencing depth(ONT):60X;
- Complete assembly of telomeres with 0 gaps;
- Contig N50 reaches 1.8 Gbp;
- Scaffold N50 reaches 2.1 Gbp;
- Assembly BUSCO completeness is 99.83%;
- Annotation BUSCO completeness is 99.91%;
⭐️ For the updated version of annotation tool EviAnn, please visit: https://github.com/linyuiz/EviAnn_update (Not recommended for now, currently under upgrade)
⭐️ For the updated version of TE transposon annotation tool, please visit: https://github.com/linyuiz/EDTA_update (Beta version)
⭐️ Updated version of assembly software: verkko (To be planned)
Genome Survey Flowchart:

Genome T2T Assemble Flowchart:

Genome Annotation Flowchart:

T2T level achieved by zgtools:
① 0 Gap: The most basic requirement;
② Full Telomeres: Telomere repeats at each chromosome end exceed 100 times (generally, over 1000 is preferable);
③ Full rDNA: Chromosomes with rDNA ends also have complete telomeres;
④ Full Centromeres: Accurate identification of centromeres across the entire genome.
For result files, please refer to the example [example], with both the visualization and results required to meet CNS standards.
- T2T Telomere Extension + Gap Filling + T2T Error Correction + T2T Comprehensive Evaluation
- Survey Analysis + Haplotype Analysis + Second/Third-Generation NT Alignment for Contamination Removal
- Conventional Genome Assembly / Typing Genome Assembly / T2T Genome Assembly (Telomere Extension, Gap Filling, Full rDNA, and PAR Region of Animal T2T-Y Chromosome) + Comprehensive Evaluation
- HiCUP Evaluation (HiC Small-Scale / HiC Large-Scale) + HiC Scaffolding Adjustment + Chromosome-Level Genome Generation + HiC Heatmap + Redundancy Removal in Unmapped Regions + Synteny Analysis + Comprehensive Evaluation
- Subphaser Subgenome Typing + Subgenome-Specific Analysis (SV Analysis / Allele Expression Imbalance Analysis / Subgenome Dominance Analysis / KaKs Differential Analysis)
- LAI Evaluation + LTR Insertion Time Analysis + LTR-RTs Phylogenetic Tree (Maximum Likelihood Method)
- Centromere Prediction (Outperforming All Currently Published Bioinformatics Centromere Identification Tools)
- Duplicate Gene Identification + KaKs Analysis + Functional Enrichment
- Circos Plot, Gene Synteny
- Annotation and Evolution
- Polyploid T2T Workflow
Using the gauges module can improve the visualization of T2T genome requirement assessments.:

This time, the jcvi2 and ngenomesyn3 modules were developed to support an unlimited number of genomes for collinearity analysis at the genome or protein level. An example diagram is shown below:

Update the run_T2T module to support SLURM clusters. The current process is now fully automated, except for Hi-C visualization, including assembly, evaluation, Hi-C heatmaps, and synteny analysis (this module is now complete). Below are the statistics for the fully telomere-to-telomere (0Gap) animal genome results:

Run the zgtools intergenic analysis. Generally, the highest proportion of transcriptome reads align to exons because transcriptome sequencing targets mRNA. Reads aligning to intron regions may originate from residual pre-mRNA or intron retention events during alternative splicing. If a high proportion of reads align to intergenic regions, it suggests incomplete genome annotation.(In general, reads in the【exon】region account for >60%, reads in the【intron】region account between 20% and 30%, and reads in the【intergenic】region account for <20%.)

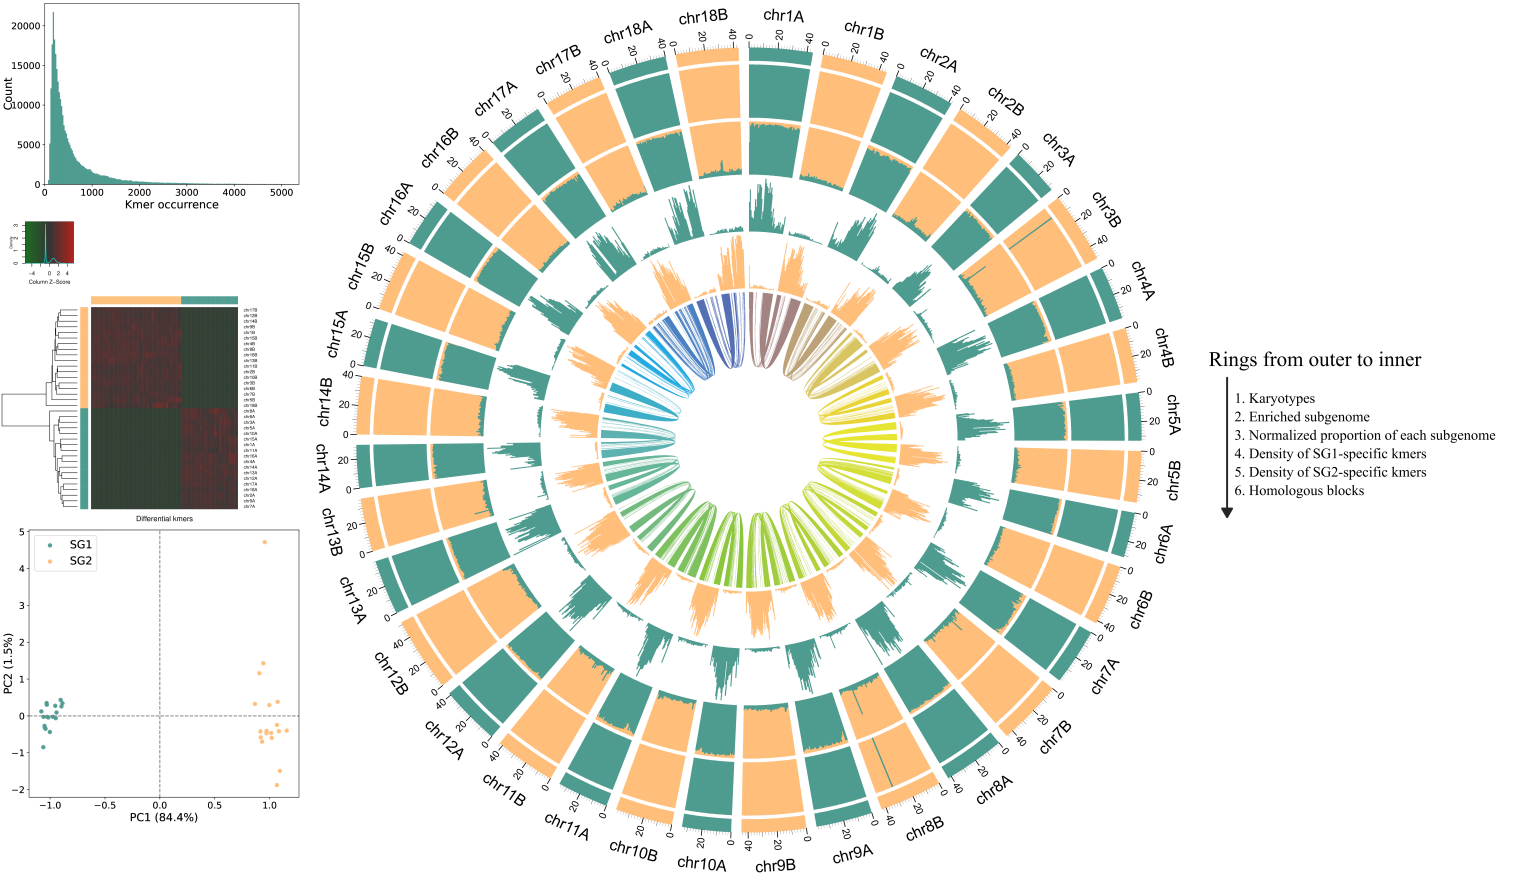
Run zgtools subphaser for analysis, just fill in the configuration file and execute it. The original software SubPhaser is well-written, and we only modified the color scheme and added a legend based on the original version. The results are as follows:
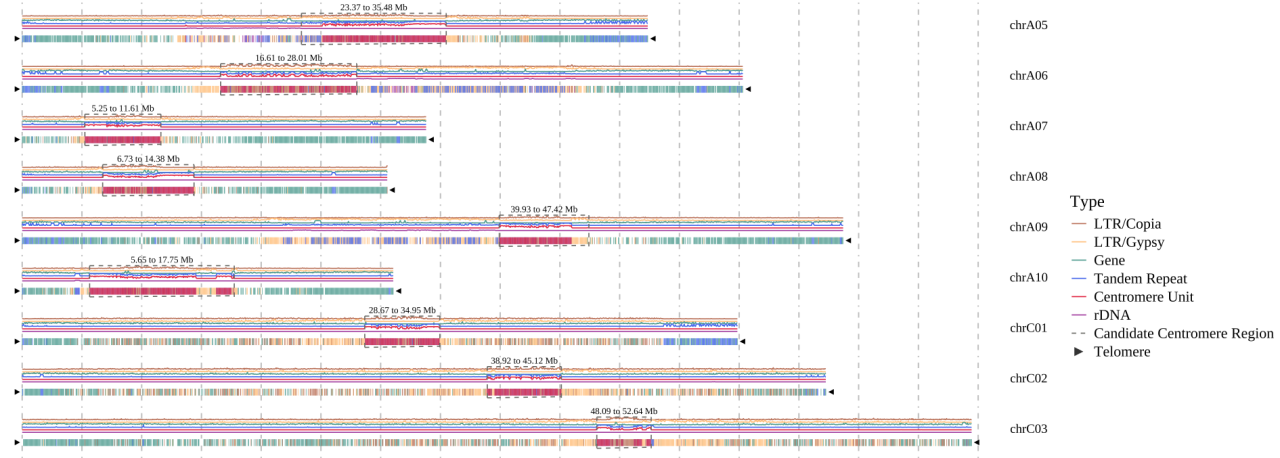
☆2024/12/24---Visualization of candidate centromeres: plotCCR (displaying candidate centromere regions)
Run zgtools plotCCR for analysis, examine the distribution of repetitive sequences to identify candidate centromeric regions, with the following results:
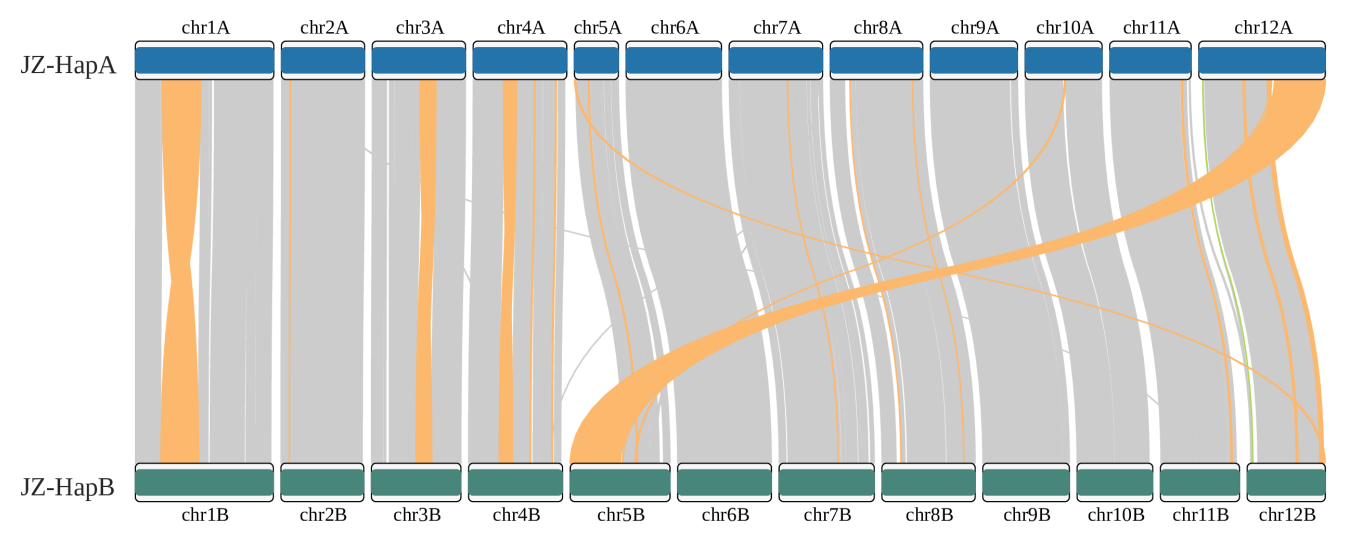
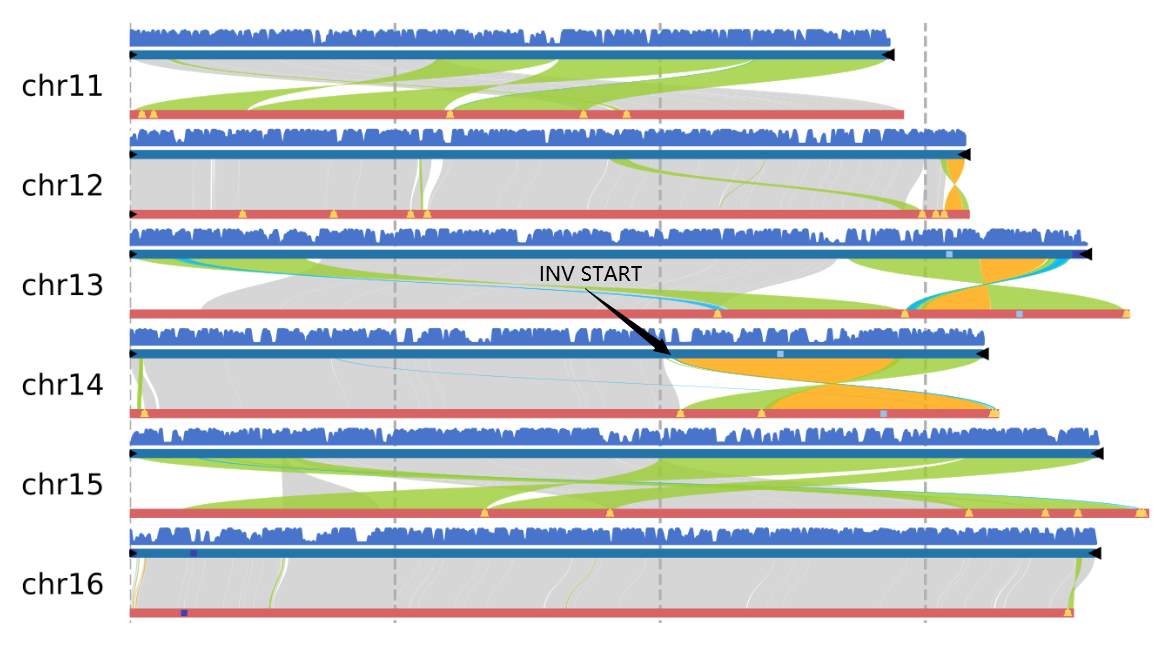
Run zgtools GetTwoSyn to perform synteny block analysis, displaying genome collinearity (gene collinearity is recommended by JCVI) and interchromosomal SVs: INV (yellow), TRANS (green), and Dup (blue). Taking the translocation between chr5 and chr12 of https://doi.org/10.1093/hr/uhae071 as an example, the results are as follows:
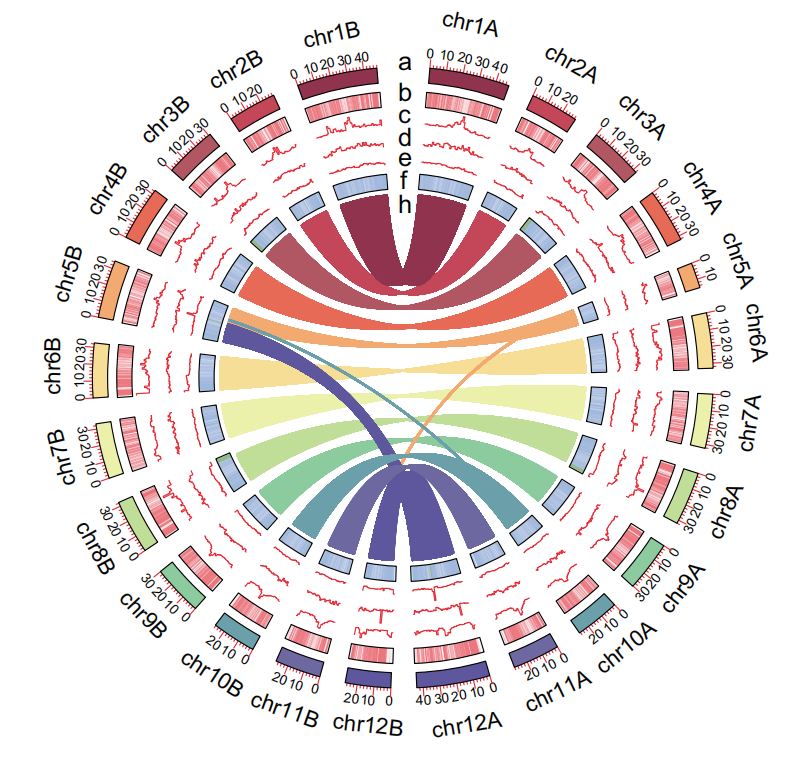
Gene collinearity circle plot:
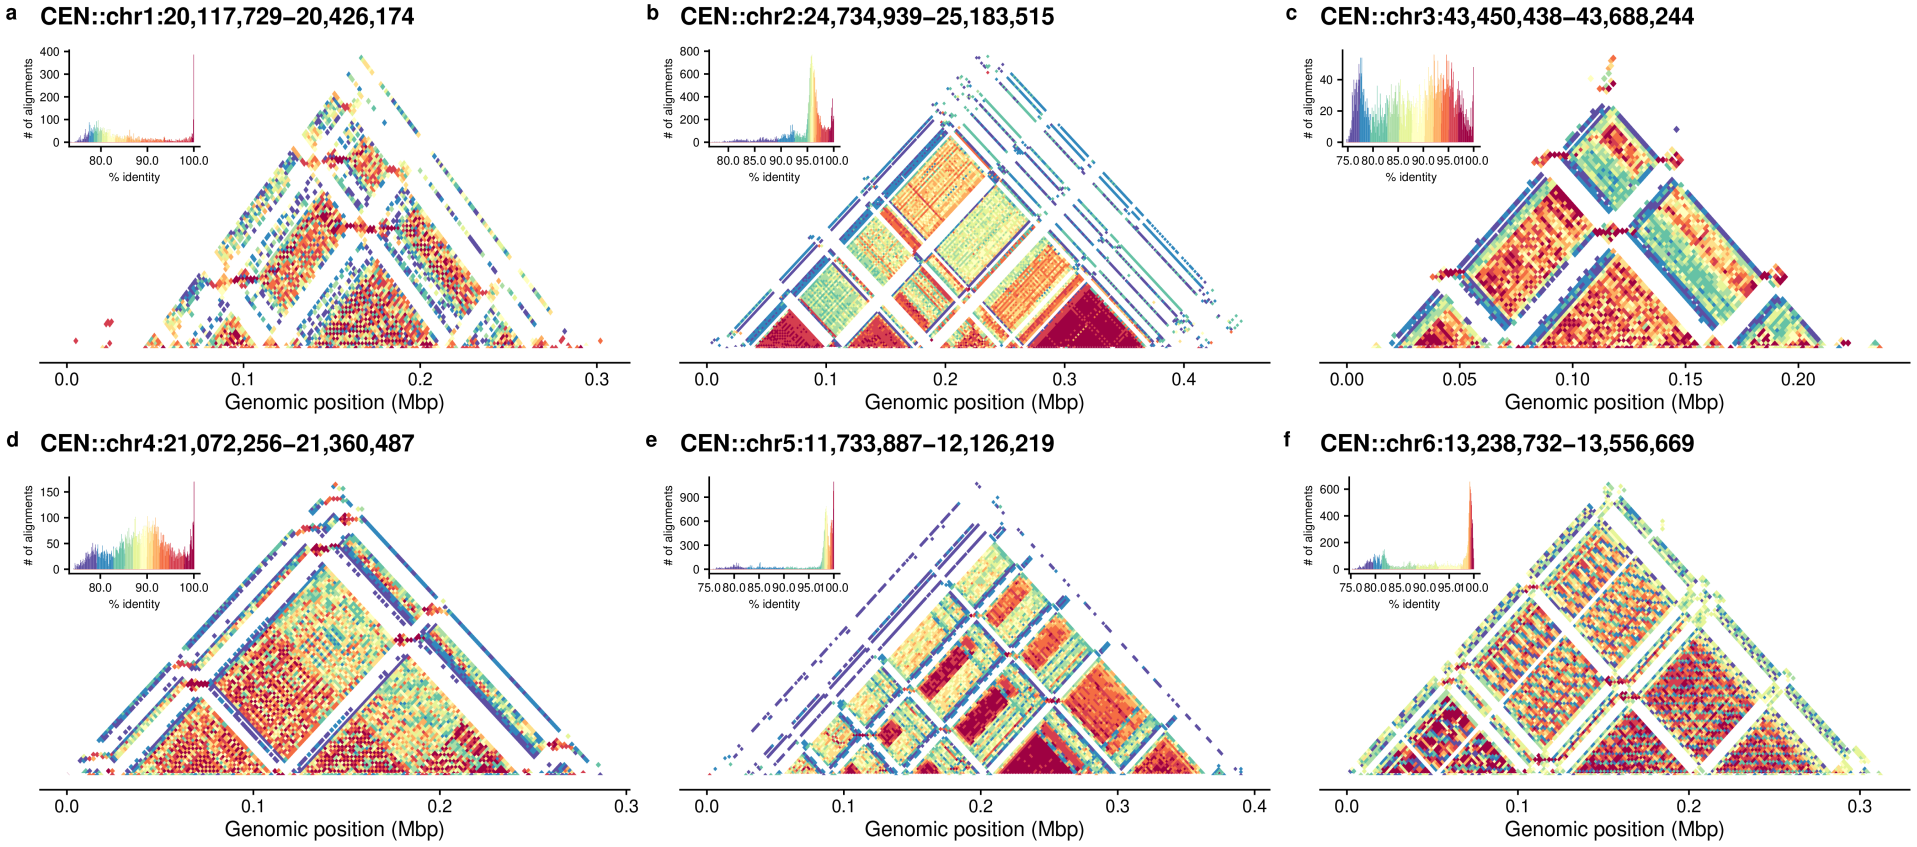
After obtaining candidate regions of centromeres by running "zgtools run_centromere," you can visualize them by executing "zgtools StainedGlass." This module has been modified from the original code to accelerate operation and support more convenient parallel processing. The result files have also been streamlined, significantly improving the visualization speed for centromeric regions. Example results are as follows:
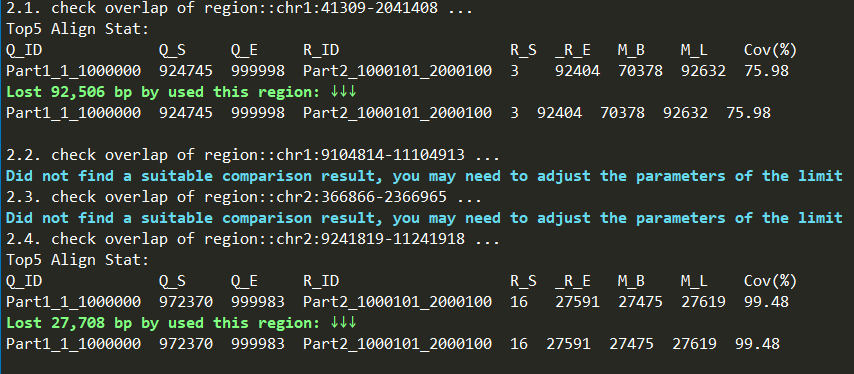
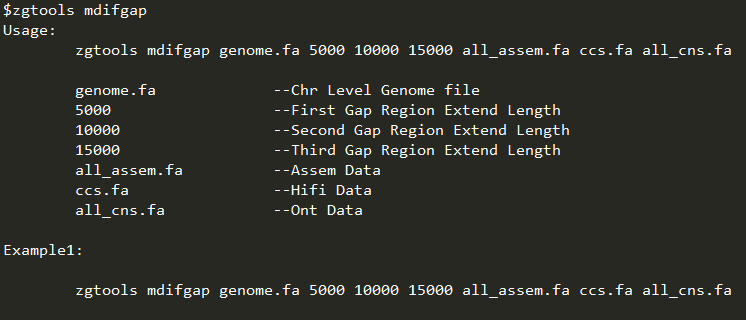
After using zgtools mdifgap for multiple data imputation of gaps, there were still some gaps that could not be filled. Juicebox inspection revealed the presence of a 600kb redundant sequence near the gap region, making it impossible to fill solely relying on reads. Therefore, the zgtools gapjoin module was introduced. By extending the gap region left and right by a certain range, the module aligns and checks for duplicated segments in this area. It then filters for high-coverage and long-aligned regions while limiting the maximum allowable genome loss, removes the redundancy near the gap, and connects the sequences to achieve gap filling. Finally, a reads coverage plot is generated for further verification. An example is shown below:
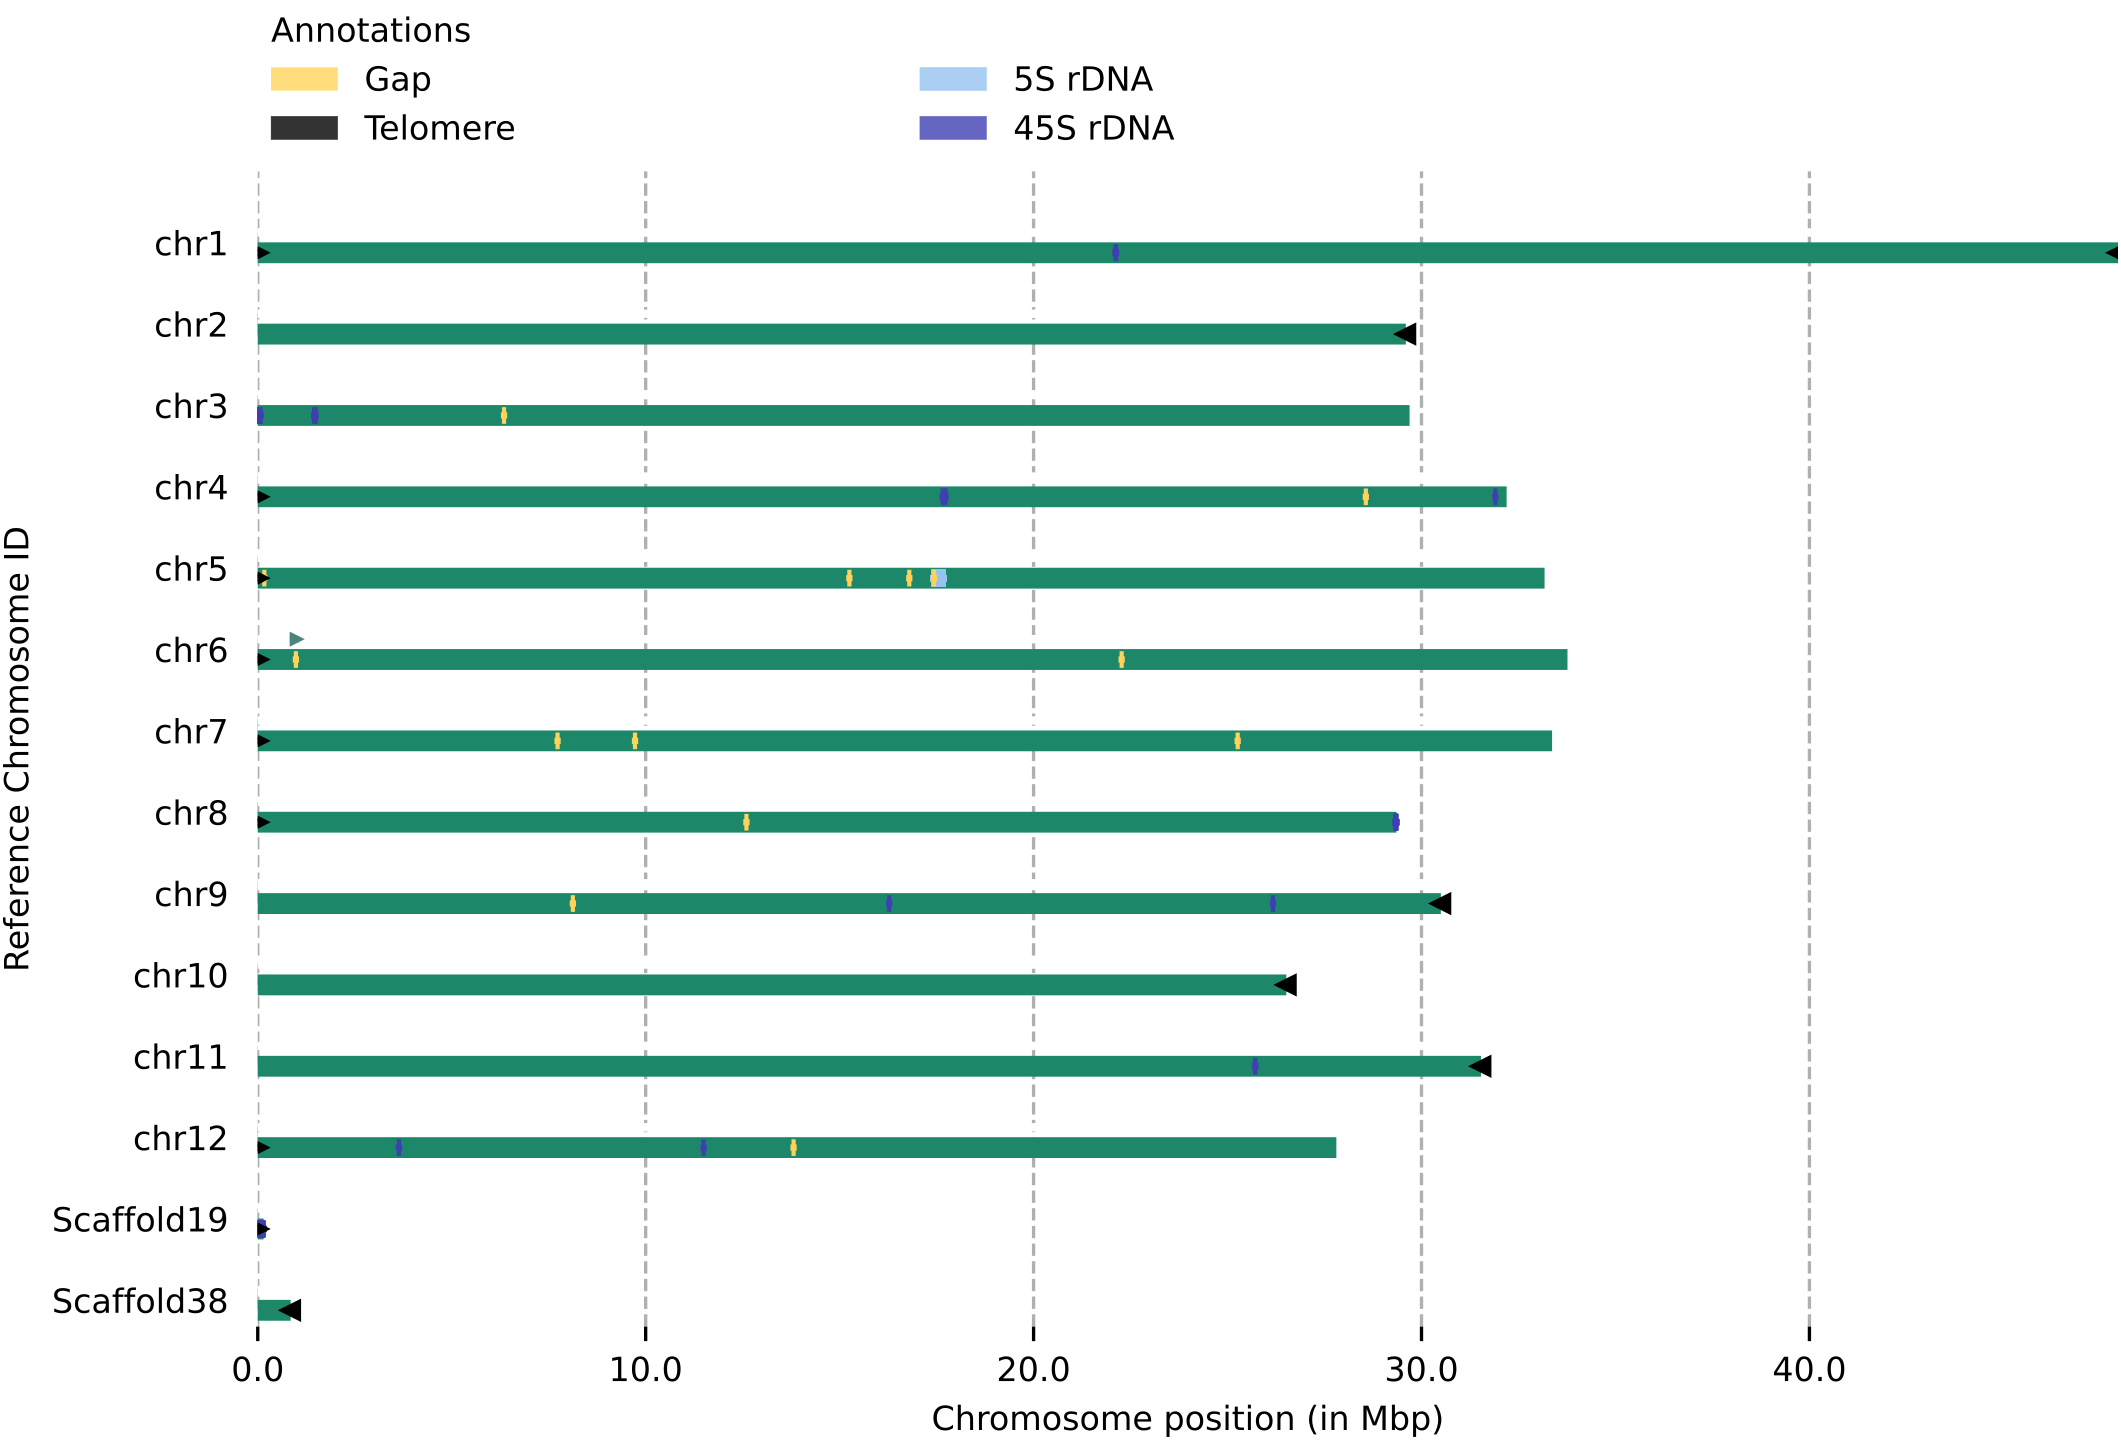
Use zgtools genomecheck to identify telomeres, gaps, and rDNA in the genome (including sequences from unanchored regions).This allows for:
① obtaining preliminary telomere information for the chromosomal portions of the genome;
② combining telomeres and rDNA from unanchored regions to recover telomeres back into chromosomal sections—for example, Scaffold19 in the sample figure can be reattached to the 45rDNA end upstream of chr3 or the 45rDNA end downstream of chr8 by examining the Juicebox map;
③ detecting whether telomere sequences are obscured by other sequences, as indicated by the green triangle marker upstream of chr6 in the figure, which shows that nearby sequences are blocked by adjacent sequences.
A Juicebox check reveals that the preceding sequence is a redundant portion of this sequence.
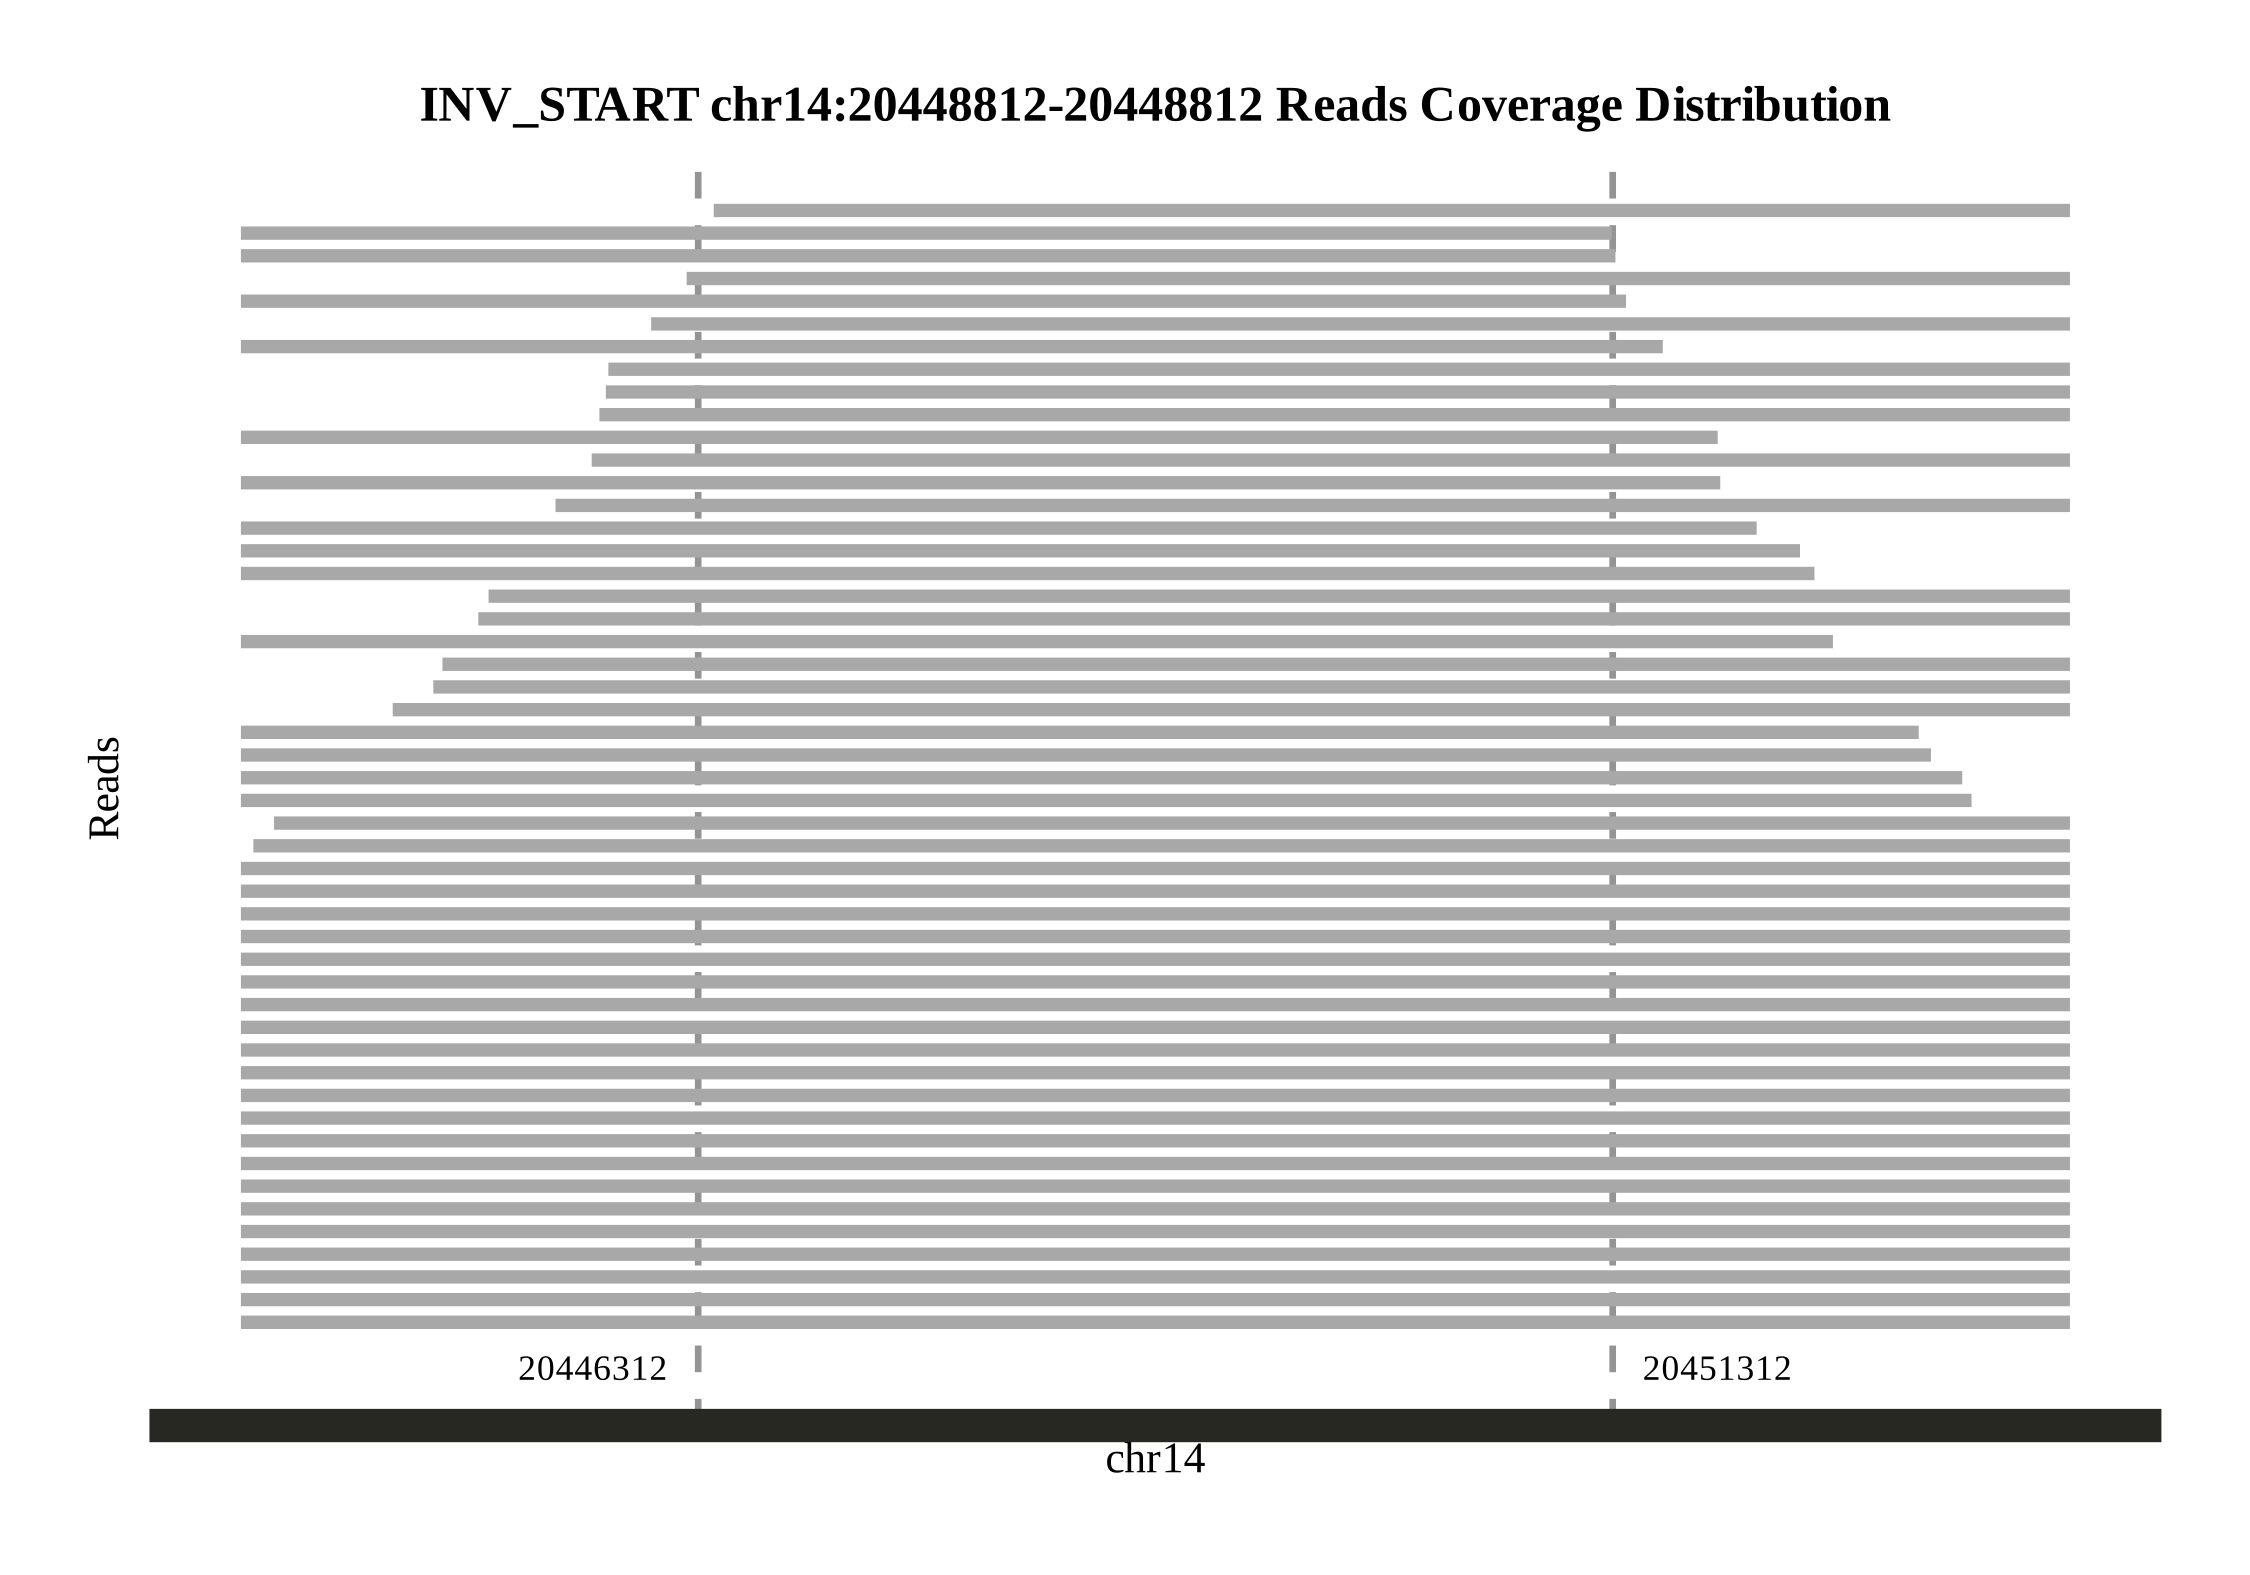
First, use the syntenic and genomesyn functions in the zgtools toolkit to perform collinearity analysis. This process will generate a genome collinearity map and a variant detection result file named Ref_vs_Query.syri.out. Subsequently, filter the structural variations (SVs) by length, retaining only those longer than 500,000 bp, and extract the start and end position information of the SVs. Next, align the HIFI and ONT data back to the genome using the minimap2 tool. Based on this, we extend the identified SV positions by 5,000 bp on both sides. Finally, batch-generate coverage plots for these regions and automatically detect read coverage. An example figure is shown below:
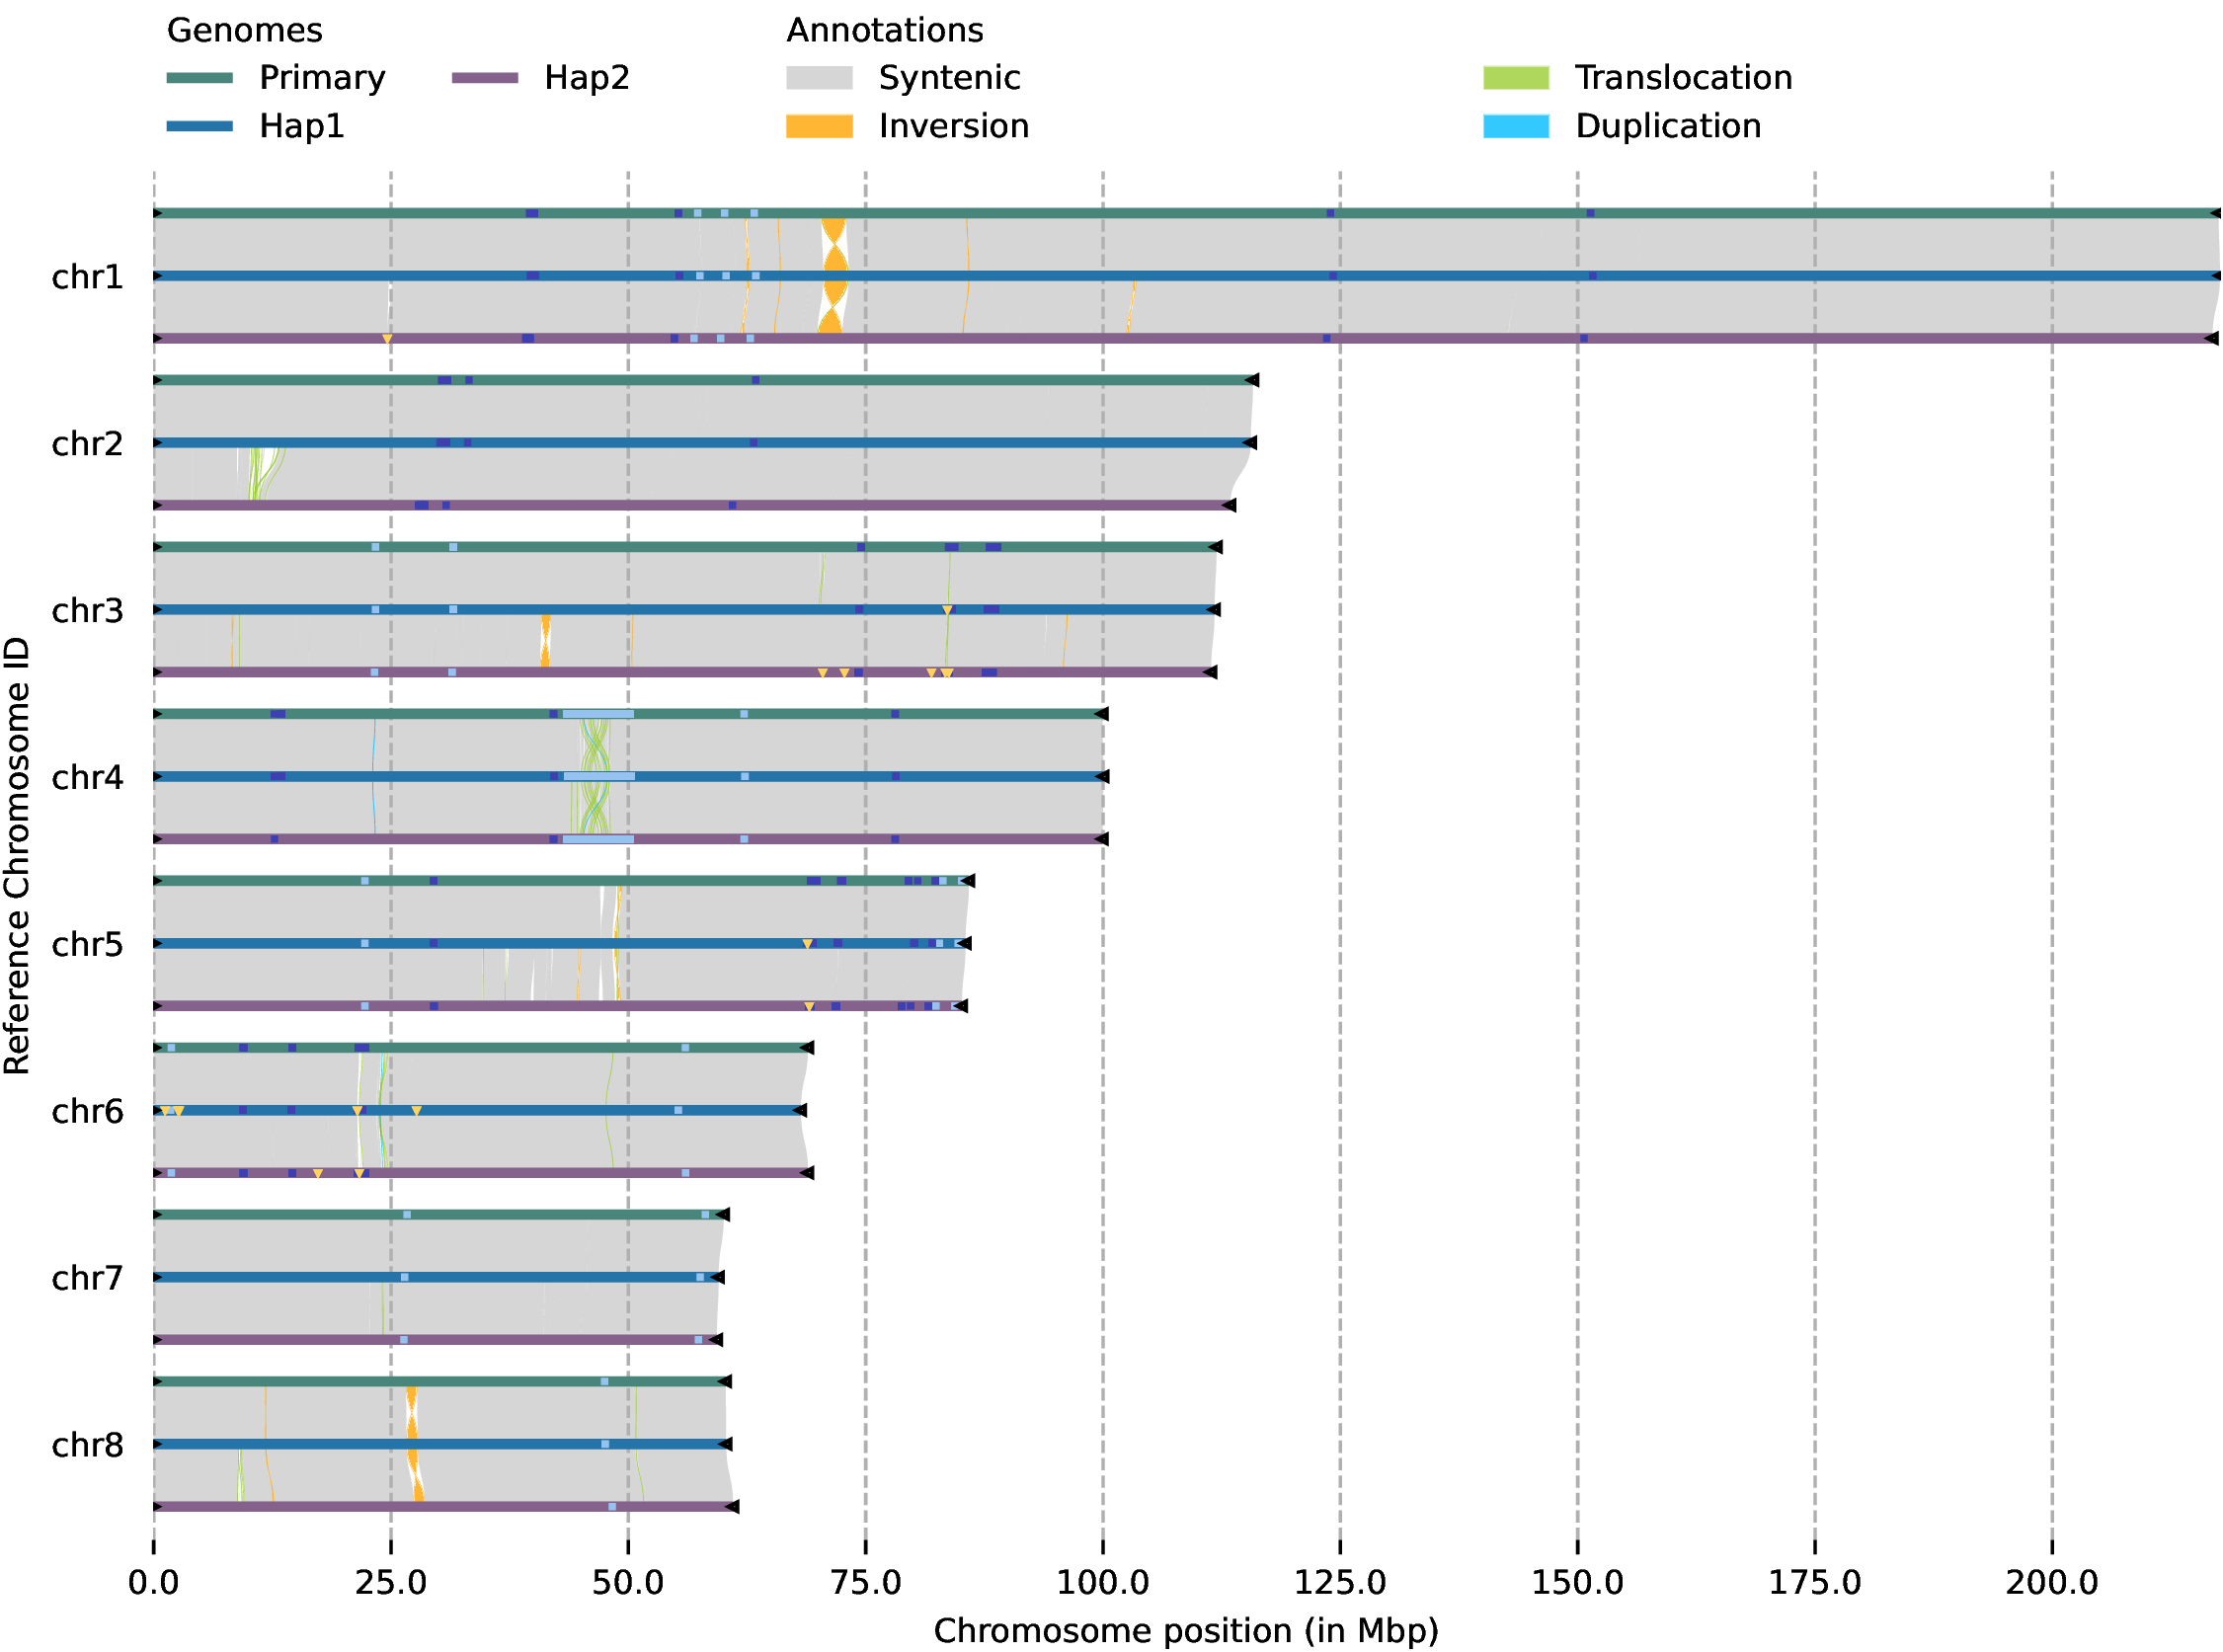
Multi-genome collinearity plot with no upper limit on the number of genomes. Black triangles in the plot represent telomeres, yellow triangles represent assembled Gap sequences (absent in T2T genomes), light blue represents 5S_rDNA, dark blue represents 45S_rDNA, "Syntenic" indicates collinear regions, "Inversion" denotes inverted regions, "Translocation" refers to translocated regions, and "Duplication" represents duplicated regions.
Test: Tests were conducted on plants with TR or LTR enrichment and fish with relatively low levels of both TR and LTR, yielding excellent results. Significant improvements were observed compared to quarTeT and CentIER. The TRF software was used to identify tandem repeat sequences, filtering for TR sequences with repeat counts >100 and unit lengths >100bp. A TR similarity network was constructed based on a community detection algorithm with an 80% similarity threshold. The screened monomer sequences were re-identified, and regions with high TE and TR coverage were filtered and integrated to obtain the core centromeric and pericentromeric regions.
Test: For the 500M genome with 17 gaps and the 2G genome with 5 gaps, the filling times were 13 minutes and 5 minutes respectively, demonstrating very fast gap-filling speed and minimal memory consumption. The process included generating read coverage plots to check for issues in Hi-C scaffolding and validating the newly filled regions with reads to ensure accuracy. Currently, other software...
① TGS-Gapcloser can easily fill in many sequences for the genome, potentially adding several million base pairs before and after gap filling. Another drawback is its tendency to consume excessive memory.
② The gap-filling function of quarTeT also has issues with poor performance. After filling the gaps, it leaves over 100MB unexplained. If you really need to fill gaps, it's better to use TGS-Gapcloser—run it slowly and fill gaps gradually to avoid memory overload. Other tools like LR-gapcloser don't perform well either.
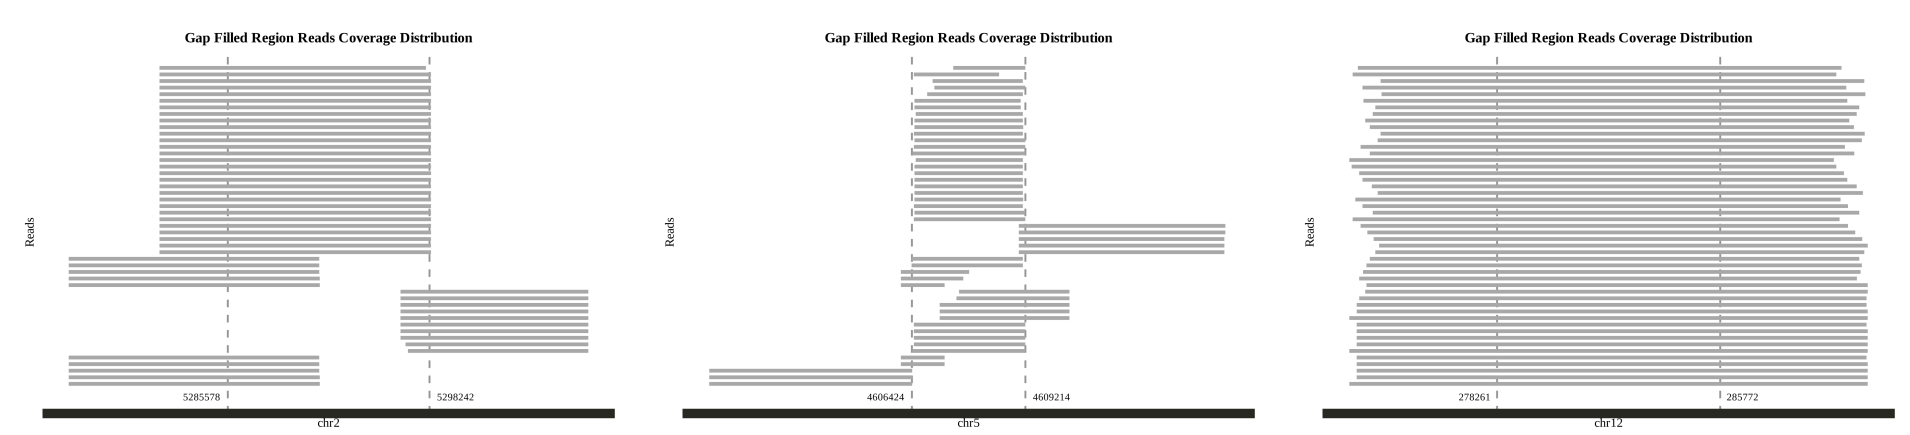
The left figure shows the results of ONT data filling; the middle figure displays the results of HIFI data filling; and the right figure presents the results from other assembly versions. As illustrated, since HIFI data is generally shorter, in some gap regions, it often requires "bridging" to connect both ends of the gap replacement area. For more complex gap regions, ONT sequences may also need "bridging" to pass through. The ideal scenario is shown in the right figure, where the original gap is free from complex redundancies and uncut sequences, allowing for effective filling.
Follow-up updates...