Repository navigation
fix(sync): merge upstream hyperdx 0096a355c - #226
Merged
Merged
Conversation


`smoke-tests/otel-collector/docker-compose.yaml` is the only compose file still on `clickhouse-server:25.12-alpine`; the root, CI, dev and e2e compose files and the all-in-one Dockerfile are on 26.8 (an LTS line that has received the recent ClickHouse Server security fixes). This aligns it.

Not run locally: the otel-collector smoke test should be run in CI. No changeset: test-only change.

🤖 Generated with [Claude Code](https://claude.com/claude-code)

Co-authored-by: Drew Davis <6097246+pulpdrew@users.noreply.github.com>


Triggered by [comment](ClickHouse/ClickStack#3467 (comment)) from @wrn14897.

Vouch: @andrewdunndev

## Summary

Mitigates [CVE-2026-98432](https://www.cve.org/CVERecord?id=CVE-2026-98432) for the OTel collector by disabling Multipath TCP in the Go runtime.

The CVE is a Linux kernel use-after-free in IPv4 TCP connection setup. The published remote-root exploit targets servers with an MPTCP listener. Since Go 1.24, `net.Listen` asks for MPTCP by default, so on a host with MPTCP enabled, every collector listener (4317, 4318, 13133, 8888) is one. The Go Security Team's runtime mitigation is `GODEBUG=multipathtcp=0`.

`docker/otel-collector/entrypoint.sh` now adds `multipathtcp=0` to `GODEBUG` before anything else runs. Every Go process the image starts goes through this script, so this one change covers:

- the collector in standalone mode (`exec /otelcontribcol`)
- the OpAMP supervisor and the collector it spawns (the supervisor's commander leaves `cmd.Env` nil when no `agent.env` is configured, so the child inherits the environment)
- the `migrate` tool
- the all-in-one images, which run the same script as `/otel-entrypoint.sh`

The value is appended rather than set with `ENV` in the Dockerfile, so a deployment that passes its own `GODEBUG` (for example from a Helm chart) keeps its other settings and still gets the mitigation. An explicit `multipathtcp=` value from the operator is left alone.

Not changed: `docker/hostmetrics` (stock contrib 0.90.0 built with Go 1.21, where MPTCP is off by default, and not referenced by any compose file or workflow).

This only reduces exposure. The Go team calls per-program MPTCP disabling fragile, and the real fix is a patched host kernel.

### How to reproduce

**Starting point:** repo root, Docker running.

**On `main`:**

1. `docker build -f docker/otel-collector/Dockerfile --target dev -t otel-mptcp .`
2. Start ClickHouse and the collector on a shared network (standalone mode, `HYPERDX_OTEL_EXPORTER_CREATE_LEGACY_SCHEMA=true`, `CLICKHOUSE_ENDPOINT=tcp://<ch>:9000`).
3. `docker exec <collector> sh -c 'tr "\0" "\n" < /proc/1/environ | grep GODEBUG'` prints nothing.

**On this branch:**

1. Same steps. The command prints `GODEBUG=multipathtcp=0`.
2. Passing `-e GODEBUG=http2client=0` gives `GODEBUG=http2client=0,multipathtcp=0`.
3. In supervisor mode (`OPAMP_SERVER_URL` set), PID 1 `opampsupervisor` carries `GODEBUG=multipathtcp=0`.

I ran all three cases locally. I could not confirm the change at the socket level: Docker Desktop's VM kernel has no MPTCP support, so listeners are plain TCP either way. It's worth checking `ss -ltnM` on a real node after rollout.

Added `smoke-tests/otel-collector/godebug.bats`, which asserts the collector's PID 1 environment. I have not run it locally.

`make ci-lint` passes. `make ci-unit` passes apart from `timeZone.test.ts` (`getTimeZoneShortName`), which also fails on `main` on my machine (ICU/locale data) and is unrelated.

### References

- Linear Issue: https://linear.app/clickhouse/issue/HDX-5860/disable-multipath-tcp-in-all-otel-collector-deployments
- Related PRs: none
- [Kernel fix](https://git.kernel.org/pub/scm/linux/kernel/git/torvalds/linux.git/commit/?id=e3f33b0a1d89d738e2b913dab519226eaf76e15b)
This PR was opened by the [Changesets release](https://github.com/changesets/action) GitHub action. When you're ready to do a release, you can merge this and the packages will be published to npm automatically. If you're not ready to do a release yet, that's fine, whenever you add more changesets to main, this PR will be updated.


# Releases
## @hyperdx/app@2.43.1

### Patch Changes

- @hyperdx/api@2.43.1
## @hyperdx/otel-collector@2.43.1

### Patch Changes

- 7a9fe57: Disable Multipath TCP in the collector image by setting `GODEBUG=multipathtcp=0`
  at startup, mitigating CVE-2026-98432. Go 1.24+ opens MPTCP listeners by
  default. Any other `GODEBUG` settings you pass are kept, and an explicit
  `multipathtcp=` value is left as is. This also applies to the all-in-one image.
  Patching the host kernel is still the actual fix.
## @hyperdx/api@2.43.1

## Summary

`getMetadata()` shares one module-level `MetadataCache`, and `getOrFetch` kept every entry for the life of the process. After an `ALTER TABLE` adds a column, the API keeps rendering queries with the column list from before the change until it restarts. As #3475 shows, a new MATERIALIZED column is not used for a filter on the Map key it covers, and grouping by it fails with `Unknown expression identifier`.

- `MetadataCache.getOrFetch` and `set` take an optional `ttlMs`. `get` drops an entry whose TTL has passed, so the next `getOrFetch` runs the query again. Entries stored without a TTL behave as before.
- `getColumns` stores its `DESCRIBE` result with a 5 minute TTL (`COLUMNS_CACHE_TTL_MS`). `getColumn`, `getMaterializedColumnsLookupTable` and the computed metric column lookup from #3191 all read `getColumns`, so they see a new column within 5 minutes.

The cost is one `DESCRIBE` per table every 5 minutes per process. Concurrent callers still share one pending query. The browser uses the same cache, so a page reload is no longer needed there either.

Things to be aware of:

- If the refresh fails (ClickHouse is down), the caller now gets the error instead of the old column list. The query that needs the columns would fail in that case anyway.
- Other cached schema data still has no TTL: skip indices, the text index lookups, `system.tables` metadata and TimeSeries table columns. I kept this PR to the column list from the issue. I can extend the TTL to those in a follow-up if you want.
- 5 minutes is a guess at "a few minutes" from the issue. Happy to change it.

### Tests

In `packages/common-utils/src/__tests__/metadata.test.ts`, with `Date.now` mocked:

- `MetadataCache`: a value stored with a TTL is returned from the cache until the TTL passes and fetched again after it. A value stored without a TTL is still cached a year later.
- `getMaterializedColumnsLookupTable`: the first `DESCRIBE` has no MATERIALIZED column, and a second one adds `__otel_materialized_k8s.namespace.name`. The lookup stays empty just before the TTL, and has `ResourceAttributes['k8s.namespace.name']` → `__otel_materialized_k8s.namespace.name` once the TTL has passed. `DESCRIBE` runs twice.

With this change all 156 tests in the file pass. With `metadata.ts` from `main`, the two TTL tests fail (the cache returns `first` instead of `second`, and the lookup stays empty). With the cache TTL but without the TTL on `getColumns`, the lookup test fails. ESLint, Prettier, `tsc` on the two changed files and `knip` for `common-utils` pass.

I did not run the issue's steps against a full `yarn dev` stack.

### How to reproduce

**Starting point:** `yarn dev`, with the steps from #3475 (the MCP `clickstack_timeseries` tool on the metrics source).

**On `main`:**

1. Call `clickstack_timeseries` on a gauge metric with `where: ResourceAttributes.k8s.namespace.name:foo`.
2. Add the `__otel_materialized_k8s.namespace.name` and `__otel_materialized_k8s.cluster.name` MATERIALIZED columns to `otel_metrics_gauge` (SQL in the issue).
3. Repeat step 1. `system.query_log` shows the filter still reads `ResourceAttributes['k8s.namespace.name']`, and grouping by `` `__otel_materialized_k8s.cluster.name` `` fails with `Unknown expression identifier`. This keeps happening until the API restarts.

**On this branch:**

1. Do the same steps, then wait 5 minutes after step 2.
2. Repeat step 1. The filter uses `__otel_materialized_k8s.namespace.name`, and the group-by works without a restart.

### How to test on Vercel preview

N/A — non-UI change.

### References

- Closes #3475
- Related: #3191 (computed metric columns), #3231

…x (#3467)

## Summary

Closes #3466

I know #3466 hasn't been through feedback yet and CONTRIBUTING asks for `Accepting PR` first. I had already written and tested this before filing the issue, so I'm opening it now in case it helps the discussion. Happy to rework it or close it if you want a different direction.

Alert notification titles always start with 🚨 or ✅. That reads well in Slack, but a destination that already says firing or resolved, such as a webhook feeding an email relay, gets the emoji in its subject line with no way to remove it.

Following review, this is now a setting on the webhook rather than the alert: an optional boolean `titleEmoji`, where `false` drops the prefix for notifications sent to that webhook. Unset or `true` leaves titles unchanged. An alert that notifies several webhooks through `@webhook-` mentions gets the prefix per destination.

- The title is built once without the emoji, and the prefix is added per channel when the dispatch jobs are queued, unless that webhook opts out.
- The field follows `description` through the webhook model, the internal and v2 webhook APIs, `openapi.json` and the common-utils types.
- The webhook form has a "Show state emoji in notification titles" checkbox, checked by default.
- The MCP `saveWebhook` tool takes the field, since its update clears omitted settings.

### How to reproduce

**Starting point:** `yarn dev`, with two webhook destinations and a saved-search alert that notifies both (one as its channel, one through an `@webhook-` mention in the message).

**On `main`:**

1. Trigger the alert. Both notification titles start with 🚨, and no setting removes it.

**On this branch:**

1. In Team Settings, edit the first webhook and untick "Show state emoji in notification titles".
2. Trigger the alert. The first webhook's title has no prefix, the second keeps 🚨, and the resolved notifications follow the same split.
3. `GET /api/v2/webhooks` returns `"titleEmoji": false` for the first webhook.

`make dev-int FILE=checkAlerts` runs the two-webhook case.

### How to test on Vercel preview

Open Team Settings, edit or create a webhook, and check that the new checkbox saves and reloads.

### References

- Linear Issue:
- Related PRs: #1339


Bumps [glob](https://github.com/isaacs/node-glob) from 13.0.6 to 14.0.2. log</summary> <p><em>Sourced from <a href="https://github.com/isaacs/node-glob/blob/main/changelog.md">glob's changelog</a>.</em></p> <blockquote> <h1>changeglob</h1> <h2>14</h2> <ul> <li>Use minimatch 11. Each portion of a pattern with magic is now matched with a <code>Matcher</code> from <code>@isaacs/nonrecursive-glob-match</code> in place of a <code>RegExp</code>, so patterns can no longer cause ReDoS. Matching follows the minimatch 11 changes, which are closer to Bash in some edge cases.</li> <li><code>Pattern#pattern()</code> returns a <code>Matcher</code> for a portion with magic. The <code>MMPattern</code> type is now minimatch's <code>ParseReturnFiltered</code>, and the new <code>MMMatcher</code> type is the <code>Matcher</code> part of it.</li> <li>Rename <code>Pattern#isRegExp()</code> to <code>isMatcher()</code>, and <code>Processor#testRegExp()</code> to <code>testMatcher()</code>.</li> <li>Remove the <code>debug</code> option, which minimatch no longer has.</li> <li>Add the <code>normalize</code> option, to normalize unicode in the pattern and in the file names that it is matched against.</li> <li><code>GlobWalker#walk()</code> and <code>walkSync()</code> return arrays in place of sets, and <code>MatchRecord#entries()</code> is removed.</li> <li><code>ignore</code> patterns that start with <code>/</code> now start at the same place as other patterns that start with <code>/</code>: the <code>root</code> option if set, or else the root of the <code>cwd</code>, such as <code>C:\</code> on Windows.</li> <li><code>ignore</code> patterns follow the <code>windowsPathsNoEscape</code> option, the same as other patterns.</li> <li>On Windows, patterns that start with a long UNC root like <code>//?/UNC/host/share/</code> walk that share, the same as <code>//host/share/</code>.</li> <li>Faster <code>ignore</code> patterns (about 1.2 to 3 times faster), and less work for each entry in a walk (about 10% faster sync, and 15% to 30% faster async, for large trees).</li> <li>Allow <code>const string[]</code> or <code>readonly string[]</code> as <code>ignore</code> option or <code>pattern</code> argument.</li> <li>When the <code>signal</code> aborts an async walk, the walk stops. Before, it rejected, but continued to read directories.</li> </ul> <h2>13</h2> <ul> <li>Move the CLI program out to a separate package, <code>glob-bin</code>. Install that if you'd like to continue using glob from the command line.</li> </ul> <h2>12</h2> <ul> <li>Remove the unsafe <code>--shell</code> option. The <code>--shell</code> option is now ONLY supported on known shells where the behavior can be implemented safely.</li> </ul> <h2>11.1</h2> <!-- raw HTML omitted --> </blockquote> <p>... (truncated)</p> </details> <details> <summary>Commits</summary> <ul> <li><a href="https://github.com/isaacs/node-glob/commit/93957bfedf11019063804027a7a5ad40d64cbe4f"><code>93957bf</code></a> 14.0.2</li> <li><a href="https://github.com/isaacs/node-glob/commit/4682e8c9babee1b385202ede36389634e12076d7"><code>4682e8c</code></a> fix: do not continue walking after signal abort</li> <li><a href="https://github.com/isaacs/node-glob/commit/668a6698a98ac760cb4809c9eb0c7a1d6e37154a"><code>668a669</code></a> 14.0.1</li> <li><a href="https://github.com/isaacs/node-glob/commit/6ff2314c74d10df0fb435d191d0dc7b28afba8f9"><code>6ff2314</code></a> allow const/readonly string[] for ignore, patterns</li> <li><a href="https://github.com/isaacs/node-glob/commit/bbe1e5d0ae0d962446606f37e9706c23ad857bb6"><code>bbe1e5d</code></a> 14.0.0</li> <li><a href="https://github.com/isaacs/node-glob/commit/d9586ad10a6976f007f20e39bcbb594ac17ecd36"><code>d9586ad</code></a> use actual published deps, not symlinks</li> <li><a href="https://github.com/isaacs/node-glob/commit/8b166379690aa39a4b76a47dff09629480ed9cb1"><code>8b16637</code></a> handle long unc forms</li> <li><a href="https://github.com/isaacs/node-glob/commit/5bcdc6531dc4b6b8d392766eed4a5ef69be270ee"><code>5bcdc65</code></a> extglobs cannot contain /</li> <li><a href="https://github.com/isaacs/node-glob/commit/d8b40c210067cbdc29cfb6615e5a750f2106ba86"><code>d8b40c2</code></a> handle root in platform-independent way, for ignores and patterns</li> <li><a href="https://github.com/isaacs/node-glob/commit/7d1c45aa20f617d136d1775e1ea196435fa657c3"><code>7d1c45a</code></a> add native fs glob test (todo on failure)</li> <li>Additional commits viewable in <a href="https://github.com/isaacs/node-glob/compare/v13.0.6...v14.0.2">compare view</a></li> </ul> </details> <br /> [](https://docs.github.com/en/github/managing-security-vulnerabilities/about-dependabot-security-updates#about-compatibility-scores) Dependabot will resolve any conflicts with this PR as long as you don't alter it yourself. You can also trigger a rebase manually by commenting `@dependabot rebase`. [//]: # (dependabot-automerge-start) [//]: # (dependabot-automerge-end) --- <details> <summary>Dependabot commands and options</summary> <br /> You can trigger Dependabot actions by commenting on this PR: - `@dependabot rebase` will rebase this PR - `@dependabot recreate` will recreate this PR, overwriting any edits that have been made to it - `@dependabot show <dependency name> ignore conditions` will show all of the ignore conditions of the specified dependency - `@dependabot ignore this major version` will close this PR and stop Dependabot creating any more for this major version (unless you reopen the PR or upgrade to it yourself) - `@dependabot ignore this minor version` will close this PR and stop Dependabot creating any more for this minor version (unless you reopen the PR or upgrade to it yourself) - `@dependabot ignore this dependency` will close this PR and stop Dependabot creating any more for this dependency (unless you reopen the PR or upgrade to it yourself) You can disable automated security fix PRs for this repo from the [Security Alerts page](https://github.com/hyperdxio/hyperdx/network/alerts). </details>

## Summary

The seed schemas in `docker/otel-collector/schema/seed/` (and their copy in `docker/clickhouse/local/init-db-e2e.sh`) pin `ZSTD(1)` on almost every column. `ZSTD(3)` gives a noticeably better compression ratio for this kind of data at a small insert-time CPU cost, and decompression speed (so query performance) stays the same. It is also the default codec of ClickHouse since 26.9 (ClickHouse/ClickHouse@9c56196a1a4a).

The codec is pinned explicitly rather than removed, because the bundled ClickHouse is 26.8 and the `_compat` schemas target servers older than 26.2: on these versions the default is `LZ4`, so removing the codec would make compression worse.

- `CODEC(ZSTD(1))` → `CODEC(ZSTD(3))`, `CODEC(T64, ZSTD(1))` → `CODEC(T64, ZSTD(3))`.
- `CODEC(Delta(8), ZSTD(1))` → `CODEC(Delta, ZSTD(3))`: the byte-size argument of `Delta` is inferred from the column type, so it is unneeded.

Only newly created tables are affected (`CREATE TABLE IF NOT EXISTS`); existing tables keep their codecs. Applied migrations in `packages/api/migrations/ch/` and test fixtures are not changed.

### How to reproduce

**Starting point:** any ClickHouse server, or `clickhouse local`.

**On this branch:**

1. All changed seed files (`00002`–`00005`, including `_compat`) were loaded into ClickHouse with `${DATABASE}` and `${*_TTL}` substituted (`toIntervalDay(30)`); every table is created successfully.

### References

- Related PRs: ClickHouse/ClickHouse#128544 (the same cleanup in the ClickHouse docs, which embed these schemas)


Co-authored-by: Cursor <cursoragent@cursor.com>
Co-authored-by: Mike Shi <mike@hyperdx.io>
## Summary

Bumps `next` from 16.4.2 to 16.4.3 to fix an intermittent `next build` failure that hit the nightly release ([failed job](https://github.com/hyperdxio/hyperdx/actions/runs/41552229777/job/125642383912)):

```
src/fonts.ts
An error occurred in `next/font`.
TypeError: Cannot read properties of null (reading '1')
    at next/dist/compiled/@next/font/dist/google/loader.js:122:78
```

Google Fonts sometimes (~1–2% of responses) returns extensionless font URLs (`https://fonts.gstatic.com/l/font?kit=...`) instead of `.../*.woff2`. In 16.4.2 the loader gets the file extension with `/\.(woff|woff2|...)$/.exec(url)[1]`, which throws on those URLs. The response is a 200, so Next's retry never runs. `src/fonts.ts` loads four Google font families, and each nightly builds the app image six times, so the odds of hitting this on any given night are high. A rerun usually passes.

Upstream issue: vercel/next.js#99114. The fix in vercel/next.js#100158 first shipped in 16.4.3. It falls back to the CSS `format('woff2')` hint, then to `woff2`.

Why not 16.4.4: our `npmMinimalAgeGate: 7d` still quarantines it, and it contains no font changes. Next's November security release is expected shortly and should be its own bump.

The lockfile diff only touches `next` and its `@next/*` packages.

### How to reproduce

The failure depends on Google's response, so it can't be triggered on demand. The upstream issue includes an offline repro that uses `NEXT_FONT_GOOGLE_MOCKED_RESPONSES`.

**On this branch:**

1. `yarn workspace @hyperdx/common-utils run build && yarn workspace @hyperdx/app run build` succeeds (webpack).
2. `node_modules/next/dist/compiled/@next/font/dist/google/find-font-files-in-css.js` contains the `formatToExtension` fallback.

### How to test on Vercel preview

N/A: no UI change.

### References

- Linear Issue:
- Related PRs: vercel/next.js#100158
…506)

## Summary

Closes #3468

Adds optional `tag`, `search`, `source` and `state` query parameters to `GET /api/v2/alerts`, so a client that wants the alerts for one service or one state gets just those from the server. Until now the route returned every alert on the team and the client filtered locally.

- Filters combine with AND. `tag`, `source` and `state` are repeatable and match any of the values given. `search` is a case-insensitive substring match on the display name, taken literally.
- `meta.total` and `X-Total-Count` count the filtered set, and `limit`/`offset` slice within it.
- Filters match stored tags and displayName, the same as the internal alerts page, since both use the shared filter builder. Tags inherited from a dashboard or saved search are not matched.
- An unrecognized `state` or `source` value now returns 400.
- With no filters the response is the same as today.

The issue isn't marked Accepting PR yet, so this is a draft and the parameter names are open to change.

### How to reproduce

**On `main`:** `curl -H "Authorization: Bearer <key>" "http://localhost:8000/api/v2/alerts?tag=prod&state=ALERT"` returns every alert; the parameters are ignored.

**On this branch:** the same request returns only alerts tagged `prod` in the `ALERT` state, and `meta.total` equals that count.

`make dev-int FILE=external-api/__tests__/alerts` runs the new cases.

### How to test on Vercel preview

N/A, API-only change

### References

- Linear Issue:
- Related PRs: #3504 touches the same router, controller and OpenAPI file; I'll resolve the overlap once one of them lands.
## Summary

Closes #3470

Stores a grouped alert's group-by values on its history row and reads them back at resolve time, so `{{attributes.*}}` and `{{var.*}}` are filled in when a group resolves after it has disappeared from the data. Until now they rendered empty on that resolve: the group had no rows left to read values from, and the joined `group` string on the history row cannot be split back into values.

- `groupValues` is a list of `{ key, value }` pairs rather than an object, since group-by column names can contain dots and Mongo would read them as nested paths.
- Live values still win. The history fallback applies only when the group has no current rows.
- Empty values are stored too. History rows written before this change have no `groupValues`; they resolve as they do today, and the next evaluation of a live group stores the values.
- The docs no longer say `{{var}}` is empty on the resolve of a vanished group.

### How to reproduce

**Starting point:** `yarn dev`, a webhook destination whose body template uses `{{var.service}}`, and a group-by alert on `service`.

**On `main`:**

1. Let the alert fire for one `service` value, then stop sending data for that value and wait out the alert window.
2. The next evaluation resolves the alert, and the webhook body has an empty `{{var.service}}`.

**On this branch:**

1. Repeat the steps above.
2. The resolve body carries the group's `service` value.

`make dev-int FILE=checkAlerts` runs the new cases: plain and dotted aliases, a generic webhook body, an empty value, and a legacy row.

### How to test on Vercel preview

N/A, API-only change

### References

- Linear Issue:
- Related PRs:

## Summary

Service map error counts, the error drill-down, and the trace waterfall now treat legacy `STATUS_CODE_ERROR` span statuses the same way the services dashboard already does. Collectors that still write that value no longer show a service or trace as error-free.

## Root cause

`errorStatusPredicateSql` already matches both `Error` and `STATUS_CODE_ERROR`. The service map still counted only `ServerSpans.statusCode = 'Error'`, and its error drill-down used the same exact match. The waterfall's `getRowSeverity` returned an error only when `StatusCode === 'Error'`. On a deployment whose collector writes `STATUS_CODE_ERROR`, those surfaces reported zero errors while the services dashboard did not.

Fixes #3203.

## Fix

The SQL predicate and a new `isErrorStatusCode` helper share one list: `error` and `status_code_error`, compared case-insensitively. The service map count and the error drill-down use the SQL predicate. The waterfall uses the helper for the error count and the row highlight. Log severity is unchanged.

## Test plan

- Before the helper accepted legacy values, `jest --testPathPatterns spanPredicates` failed 5 cases (`ERROR`, `error`, `STATUS_CODE_ERROR`, `status_code_error`, `Status_Code_Error` expected true, received false) when `isErrorStatusCode` was an exact `=== 'Error'` check.
- After the fix, from `packages/common-utils`: `node ..\..\.yarn\releases\yarn-4.13.0.cjs exec jest --coverage=false --testPathPatterns spanPredicates` passed, 17 tests.
- From the repo root: `node .yarn/releases/yarn-4.13.0.cjs workspace @hyperdx/app exec jest --coverage=false --testPathPatterns "useServiceMap.test|ServiceMap/__tests__/utils.test"` passed, 86 tests.
- `node .yarn/releases/yarn-4.13.0.cjs workspace @hyperdx/common-utils build` succeeded.
- `eslint --flag v10_config_lookup_from_file --quiet` on the touched files exited 0. Prettier was run on those files.

### How to reproduce

**Starting point:** a trace source whose status column contains `STATUS_CODE_ERROR` (legacy collector) as well as `Error`. The public demo dataset does not store that legacy value, so the unit tests above are the reliable reproduction.

**On `main`:**

1. Open the service map for that source. Nodes whose spans use only `STATUS_CODE_ERROR` show 0.00% errors.
2. Open a trace that contains a `STATUS_CODE_ERROR` span. The waterfall does not mark that span as an error, and the header error count skips it.

**On this branch:**

1. The same service map counts those spans, and the error drill-down filter is `lower(StatusCode) IN ('error', 'status_code_error')`.
2. The waterfall highlights those spans and includes them in the error count.

### Screenshots or video

No screenshots. The change is the status match used for counts and highlighting, not layout. Reproducing the visible difference needs rows stored as `STATUS_CODE_ERROR`, which play.hyperdx.io does not provide.

### How to test on Vercel preview

N/A. This is not a layout change. The corrected counts show up only when the selected trace source stores `STATUS_CODE_ERROR`.

### References

- Fixes #3203
- Related PR: #3181 (services and LLM dashboards)
…H (#3535)

## Summary

Backports security fixes from EE:

1. `createdBy` and `team` can no longer be updated by dashboard PATCH requests.
2. `createdBy` can no longer be updated by saved search PATCH requests

### Screenshots or video

### How to reproduce

Send PATCH dashboard or saved search API requests that include `createdBy` or `team` and observe that the values are ignored.

### How to test on Vercel preview

### References


- Linear Issue:
- Related PRs:

## Summary

Agents investigating an incident often need several independent raw SQL queries (compare two sources, a few breakdowns of the same window). Today each one is a separate `clickstack_sql` round trip. This adds a `queries` array so one call runs up to 10 of them in parallel.

- `clickstack_sql` takes either `sql` (unchanged) or `queries: [{ id?, sql, connectionId?, sourceId? }]`. Queries share `startTime`/`endTime` and default to the top-level `connectionId`/`sourceId`.
- Queries run 5 at a time under one 60s deadline for the whole call. Queued queries that reach the deadline are never sent to ClickHouse.
- Each result reports `ok`, `error`, or `timeout`, in input order, with its index and optional `id`. One bad query doesn't fail the call; `isError` is set only when every query fails.
- The 100k-character response budget is split across the batch (at most 50k per query, the current single-query limit).
- The existing per-query checks (dashboard-only macros, source not found, connection mismatch, `$__sourceTable` without a source) moved into `prepareSql.ts` with no behavior change. Source lookups are cached per call.
- `withDeadline` moved from `queryTiles.ts` to `mcp/utils/timeout.ts` so both batch tools share it.
- Observability: `mcp.sql.mode` and `mcp.sql.batch.*` span attributes, plus a `hyperdx.mcp.sql.batch.queries` counter tagged by status.

Schema change to note: `sql` is no longer in the tool's `required` list, since `sql` and `queries` are alternatives. The handler rejects calls that pass both or neither.

We looked at MCP tasks for this and decided against them for now: the SDK API is experimental, and the 2026-07-28 spec moved tasks into a separate, redesigned extension that the v2 SDK doesn't implement on the server.

### How to reproduce

**Starting point:** `yarn dev`, then connect an MCP client (e.g. `yarn dev:mcp` in `packages/api` for the inspector) with a personal API key.

**On `main`:**

1. Call `clickstack_sql` with `queries: [{ "sql": "SELECT 1" }]` and any `connectionId`. The call fails because `sql` is required and `queries` is unknown.

**On this branch:**

1. Call `clickstack_sql` with a `connectionId` and `queries: [{ "id": "a", "sql": "SELECT 1 AS v" }, { "id": "b", "sql": "SELECTT 1" }]`.
2. Confirm the response has `summary: { total: 2, ok: 1, error: 1, timeout: 0 }`, rows for `a`, and a syntax error for `b`.
3. Call it with only `sql: "SELECT 1"` and confirm the response matches `main`.

### How to test on Vercel preview

N/A — non-UI change.

### References

- Linear Issue: HDX-5747
- Related PRs:
…#3520) ## Summary Fixes #3519 Selecting a JSON subcolumn whose key is not a bare identifier — e.g. `` event.`@request_id` `` — made the row side panel come up blank. ClickHouse reports the result column name for such a select without backticks (`event.@request_id`). The row side panel rebuilds a WHERE clause from the displayed result columns to fetch the full row (`useRowWhere` → `quoteResultColumnNameIfNeeded`). That helper left any dotted name untouched, so the detail query referenced `event.@request_id` raw — where `@request_id` is not a valid bare identifier — which matched zero rows and left the panel empty. The helper now splits a plain dotted result-column name on . and quotes each segment that isn't a bare identifier (event.`@request_id`, event.`200`). Valid paths like json.a.b are unchanged. JSON type casts and sub-object accessors, which ClickHouse already reports backticked (col.path.:`String`, col.^`sub`), are kept as is. Names that aren't plain paths, like function calls and literals, are still left verbatim. ### Screenshots or video The change is in the row detail side panel. "Before" is the empty panel the broken detail query produces; "After" is the same panel populated with the selected event (verified by the E2E test below — it fails on `main` and passes on this branch). | Before | After | | :----- | :---- | |  | Same panel, populated — asserted by `json-at-prefixed-key-row-details.spec.ts` | ### How to reproduce **Starting point:** full-stack `yarn dev` (needs a JSON-column table), or the E2E `E2E Interesting Filter Keys` source seeded by this PR. Schema/seed: ```sql CREATE TABLE default.hyperdx_row_repro ( timestamp DateTime('UTC'), event JSON(max_dynamic_paths=0, `@request_id` Nullable(String)) ) ENGINE = MergeTree PARTITION BY toDate(timestamp) ORDER BY timestamp; INSERT INTO default.hyperdx_row_repro VALUES ('2026-11-02 12:53:33', '{"@request_id":"request-A"}'); ``` **On `main`:** 1. Create a log source for the table, Timestamp Column = `timestamp`. 2. Set the time range to cover the seeded row. 3. Set SELECT to `` timestamp, event.`@request_id` ``. 4. Open the row details → panel is blank (the detail query returns `rows: 0`). **On this branch:** 1. Same steps → the row details panel loads the selected event. ### How to test on Vercel preview N/A — the fix needs a JSON-column schema with a seeded row, which the demo server does not provide. Covered by the full-stack E2E test instead. ### References - Linear Issue: Closes HDX-5867
Triggered by [comment](ClickHouse/ClickStack#3548 (comment)) from @brandon-pereira.

Vouch: @bcanvural
## Summary

Adds a time zone selector to the time picker on the search and dashboard pages. It overrides the User Preferences time zone for that page only and is kept in the `tz` URL param.

- `TimeZoneOverrideProvider` reads `tz`; `useDisplayTimeZone` prefers it over the user setting, so everything on the page switches together. Unknown values are ignored.
- The picker input shows the zone in use (e.g. `UTC-7`), highlighted when it isn't the browser's. The popover ends with the selector plus "Default", "UTC" and "Local" buttons; User Preferences gets "UTC" and "Local".
- Short zone labels are UTC offsets instead of abbreviations (`UTC-7`, not `PDT`). The selector shows the offset on each option and the selected value, and searches by it.
- Links from charts and tables to Search and other dashboards carry `tz`. External links don't.

The override isn't saved with saved searches or dashboards.

### Screenshots or video

<img width="529" height="243" alt="Screenshot 2026-10-30 at 10 39 50" src="https://github.com/user-attachments/assets/5cab281b-441d-48f0-9ae9-74d2c51abad7" />


<img width="664" height="319" alt="Screenshot 2026-10-30 at 10 40 02" src="https://github.com/user-attachments/assets/1822d592-ab3a-4597-b84f-78ba141d5349" />


### How to test on Vercel preview

**Preview routes:** /search, /dashboards

**Steps:**

1. On /search, click the time picker input (`data-testid="time-picker-input"`), click the "Time zone" field (`data-testid="time-picker-time-zone-select"`), type "tokyo" and click "Asia/Tokyo".
2. Verify the badge (`data-testid="time-picker-time-zone"`) shows "UTC+9" and the URL contains `tz=Asia%2FTokyo`.
3. Open the time picker, click "Default" (`data-testid="time-picker-time-zone-default"`), and verify `tz` is no longer in the URL.
4. On /dashboards, open any dashboard, repeat step 1, and verify the badge shows "UTC+9".

### References

- Linear Issue: Closes HDX-5741
- Related PRs: #3445, #3447, #3449

Fixes #3526.

`queryTileWithEvidence` now reports a failed query when an MCP transport
succeeds but the returned content is not valid JSON. Malformed text no longer
counts as evidence with `success: true`. Empty or whitespace-only content keeps
the existing successful no-data behavior.

Added regression coverage for malformed content, empty content, valid rows, and
valid content without a result.

Validation:

- `yarn workspace @hyperdx/hdx-eval lint`
- `yarn workspace @hyperdx/hdx-eval tsc --noEmit`
- `yarn workspace @hyperdx/hdx-eval jest --runInBand src/__tests__/api.test.ts --coverage=false` (4 passed)
- Full hdx-eval tests: 413 passed; 2 unrelated Windows path assertions failed in
  `src/__tests__/runPath.test.ts` because the fixture expects `\tmp\...` while
  Windows returns `C:\tmp\...`.

…(#3536) Trims the fixed chrome above the trace waterfall so the first span lands about a third of the way down a 1080p screen instead of past the middle. Nothing the panel shows is dropped: the repeats go, and the zoom hint moves into space the chart already had. ## Summary Opening a span from search stacked several things above the waterfall that either repeated information or spent a full row on a one-line hint: - a bordered **SpanName** box repeating the span name that the panel title (the breadcrumb) already shows in bold - a lone `ServiceName` chip repeating the service from the metadata row right above it - a full-width row for the "⌘/Ctrl + scroll to zoom" hint - loose gaps after the minimap, below the trace attributes, and between the axis and the first span Changes: - **Trace header:** skip the body box when the panel title is a single breadcrumb holding the span name, and the name is at most 40 characters, so the title shows it in full even in a narrower drawer. Longer names keep the box, and so do breadcrumb trails (a span opened from a session, hops between spans, **View Trace** from a log), where crumbs share one row and can cut the name off. Log panels keep their body box. - **Service chip:** trace panels no longer add the implicit `serviceNameExpression` chip. The metadata row shows the service, and the span detail pane next to the waterfall still offers **Add to Filters**, **Search for this value only**, and **Copy value** on `ServiceName`. Highlighted attributes configured on the source still render, and log panels keep the chip. - **Zoom hint:** moves from its own row into the timeline's top-left corner, the empty cell above the span labels next to the axis ticks. It's plain dimmed text in the axis label font, on the same baseline as the ticks, so it reads as the label column's header. The same shortcut is listed in the side panel's keyboard shortcuts dialog. - **Spacing:** drops the minimap's bottom margin (the controls row below already spaces it), moves the bottom margin of `DBHighlightedAttributesList` to its two callers so the header doesn't stack it on top of its own padding (log panels get the same tighter gap below their chips), and cuts the gap between the axis and the first span from 32px to 20px. The hover time label reaches 37px below the top of the chart, so the first span (now at 44px) still clears it. Measured on the same trace and data at 1920x945 (a 1080p screen minus browser chrome), identical in light and dark: | | `main` | This branch | | :-- | --: | --: | | Tabs start at | 218px | 82px | | First waterfall span | 506px (53.6% down) | 307px (32.4% down) | | Spans visible without scrolling | 18 | 26 | | First span, long span name or View Trace | 506px | 386px (box kept) | ### Screenshots or video Same trace, data, viewport (1920x945), and theme on both sides: | Before | After | | :----- | :---- | | 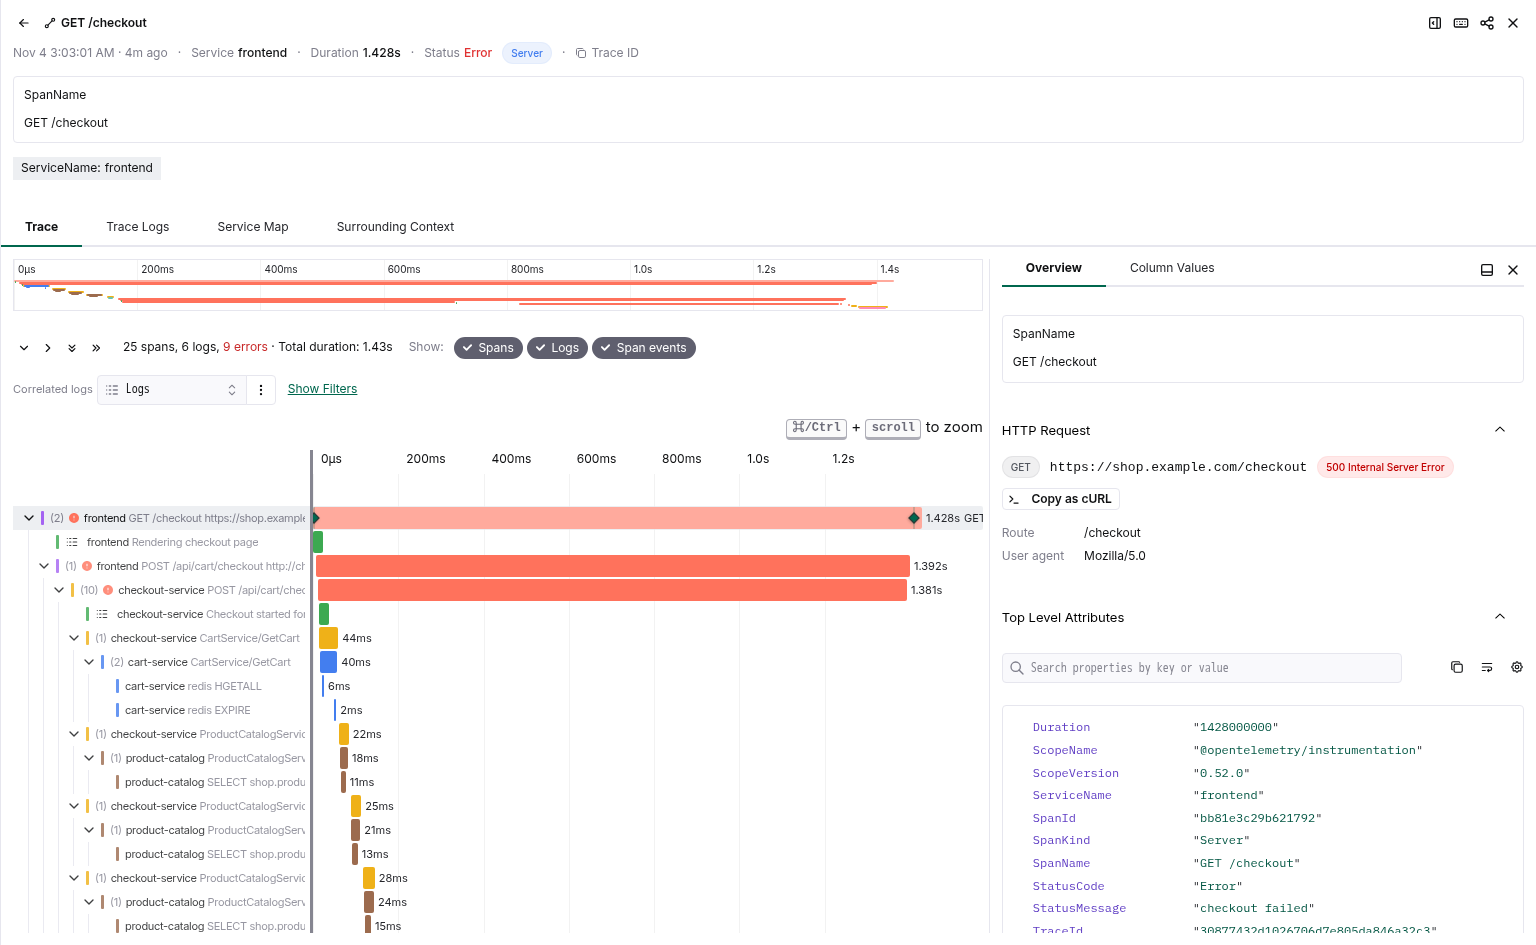 | 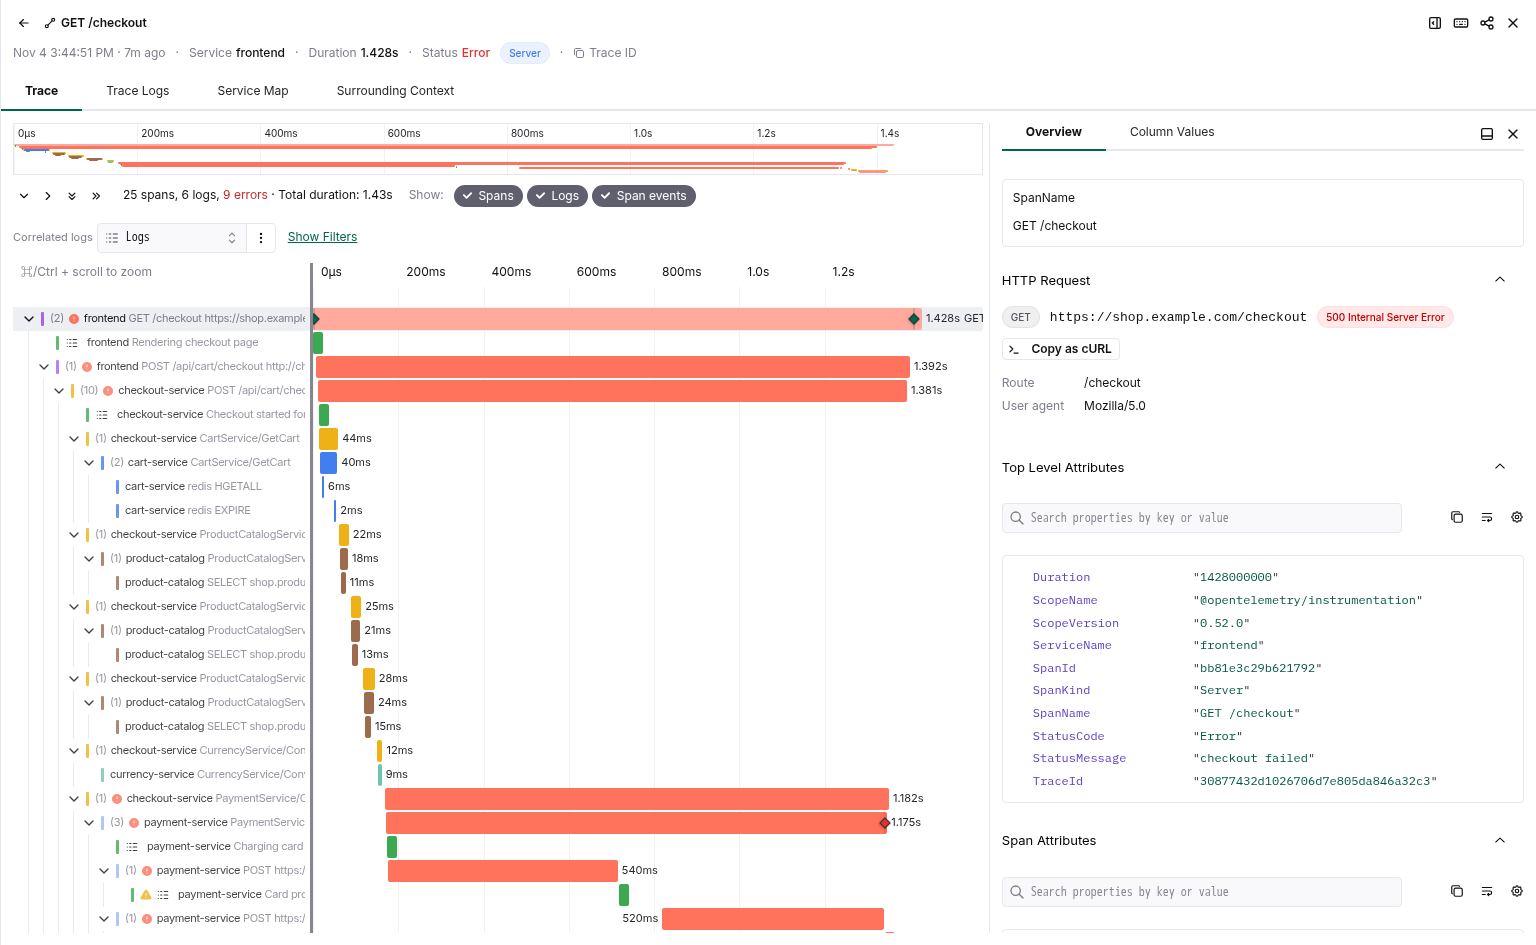 | | 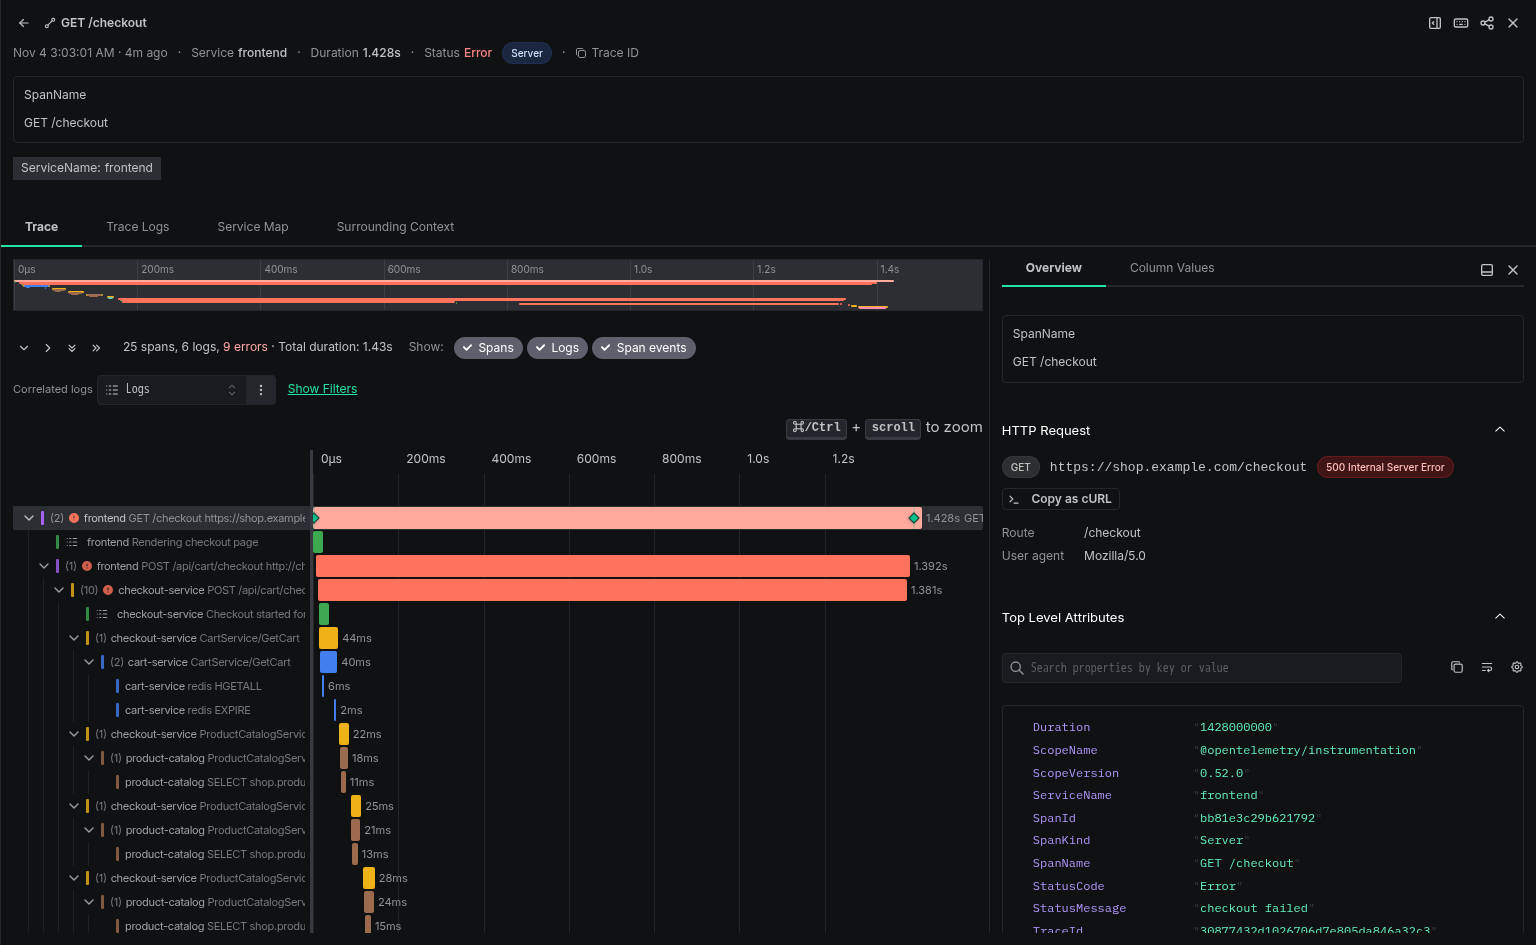 | 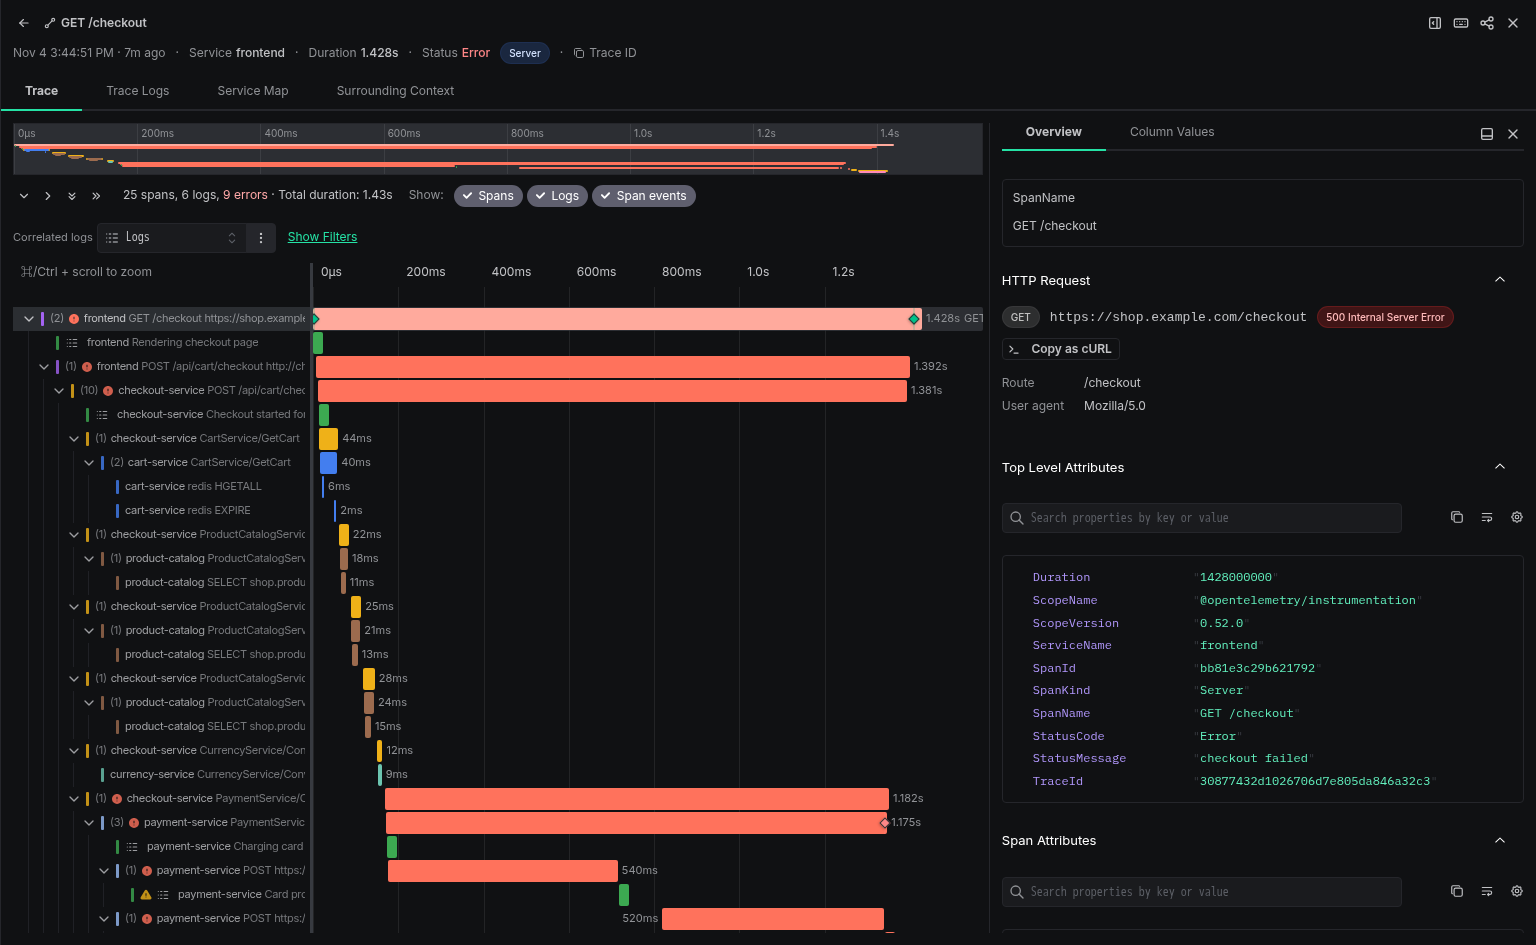 | A span name longer than 40 characters keeps the box, so the full statement stays readable: 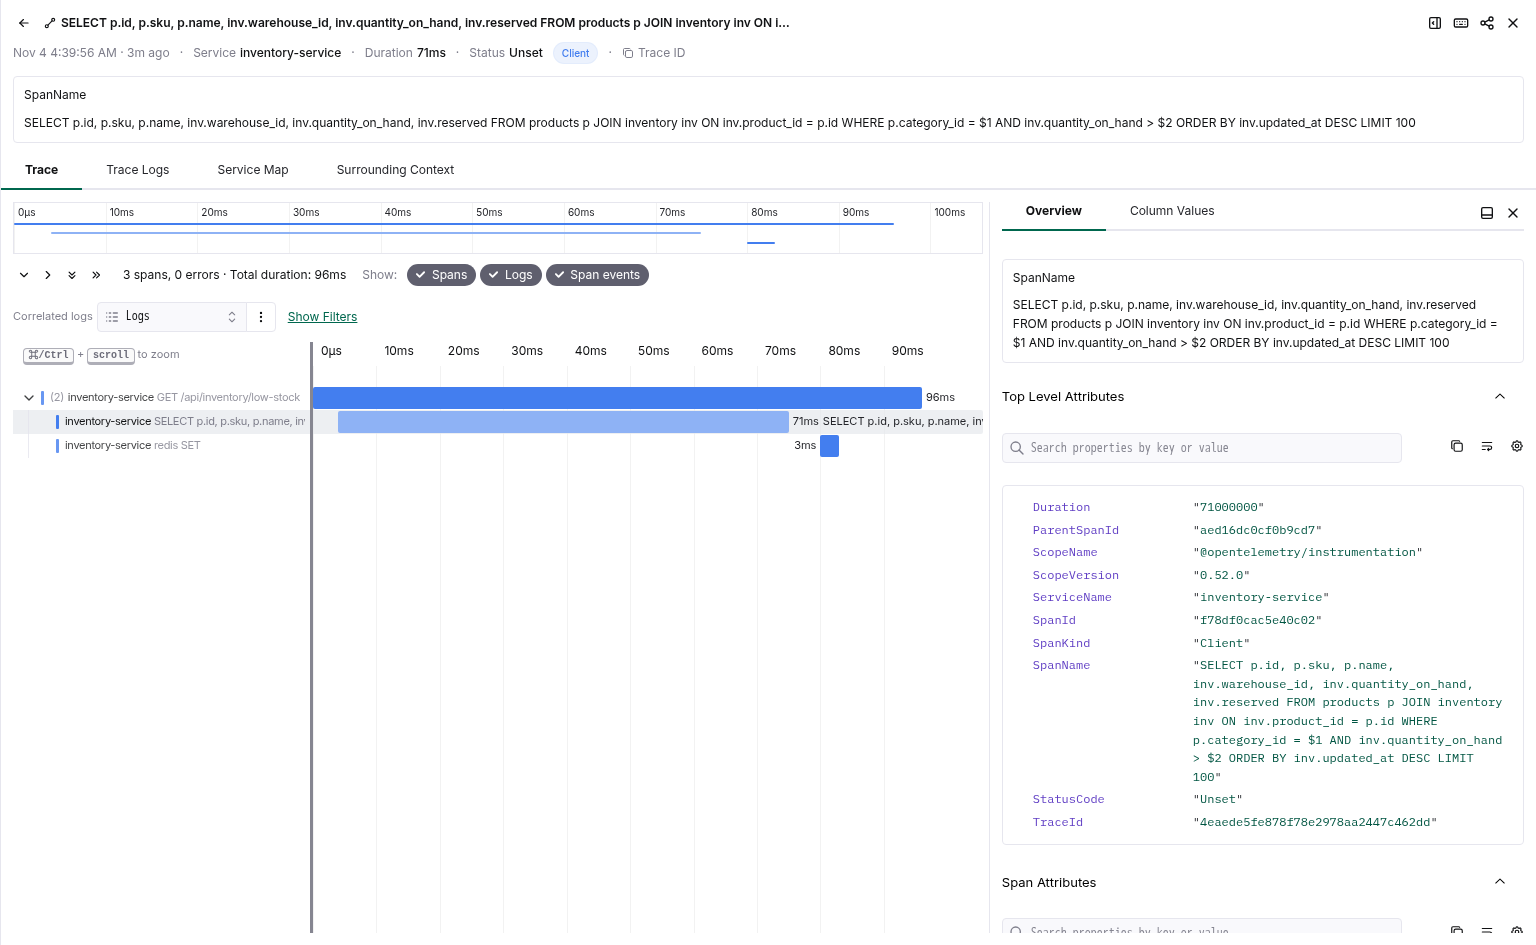 The zoom hint in the chart corner, light and dark:   ### How to reproduce **Starting point:** `yarn app:dev:local` connected to the demo server (onboarding, then "Connect to Demo Server"), or the Vercel preview on this PR. **On `main`:** 1. Open **Search** and pick the **Demo Traces** source. 2. Click any span in the results table. 3. The waterfall starts below the **SpanName** box, the `ServiceName` chip, the tabs, the minimap, the controls, and a separate "⌘/Ctrl + scroll to zoom" row. **On this branch:** 1. Same steps. The tabs sit right under the metadata row, the hint sits in the chart's top-left corner, and the first span starts noticeably higher. ### How to test on Vercel preview **Preview routes:** /search **Steps:** 1. Open /search. If the **Welcome to ClickStack** dialog appears, click **Connect to Demo Server**. Then select the **Demo Traces** source from the source picker. 2. Click the first row in the results table. 3. Verify the side panel opens on the **Trace** tab with no box labeled "SpanName" between the metadata row and the tabs. 4. Verify `[data-testid="timeline-zoom-hint"]` is visible inside the waterfall and reads "⌘/Ctrl + scroll to zoom". 5. Click a different span in the waterfall and confirm its details open next to the waterfall. ### Test plan - [x] unit: `isSpanNameShownInTitle` and `getHeaderHighlightExpressions` are tested directly in `DBRowSidePanel.compactHeader.test.ts`: the 40/41 character boundary, breadcrumb trails, a title that isn't the span name, no body value, log panels, the service chip on trace and log panels, and configured highlights - [x] unit: `DBRowSidePanelHeader` tests for `bodyShownInTitle` and the empty attribute list, and a `TimelineChart` test for the hint placement; each new assertion fails when its guarded line is reverted - [x] full app unit suite, app `ci:lint` (tsc, eslint within the warning budget, stylelint), ratchet, knip - [x] manual, local stack with a seeded 25-span checkout trace and a long SQL span name: before and after at 1920x945 in light and dark, hover time label clearance on the first span, View Trace from a log, log panel keeps its body box and chip - [x] viewport: 1920x945 and 1366x768; the corner hint fits the default label column at both, and truncates with an ellipsis if the column is dragged narrower - States: the waterfall's loading, empty, and error branches render exactly as before; only the header and chart chrome around them changed ### What's not in this PR - The waterfall controls row wraps when the span detail pane is open on the side (two lines at 1920, three at 1366), same as on `main`. Moving the **Correlated logs** source picker behind **Show Filters** would keep it to one line; that felt like a separate call. - Log panels also show the service twice (metadata row and chip). I left them alone to keep this change to the trace view. ### References - Related PRs: #2541 (single drawer header and metadata row), #2552 (timeline minimap)

…terms for body text (#3548)

Refs #3538

## What

Only descriptions and the query guide change; Lucene processing is untouched.

- **Query tool `where` / `whereLanguage` descriptions** (`packages/api/src/mcp/tools/query/schemas.ts`):
  - for an exact match, quote the value: `SpanKind:"Server"` compiles to `=`, so a sort-key column such as `ServiceName` can use the primary key (SQL `=` is still listed);
  - for text in the log body, write the term or phrase without a field name. That uses the source's token/text index; `Body:term`, `Body LIKE` and `Body ILIKE` read the whole column, and `Body:"…"` is exact equality on the whole body.
- **Query guide prompt** (`packages/api/src/mcp/prompts/dashboards/content.ts`): the same two points in the SUBSTRING MATCHING section and in common mistake 15; the "Contains" example now uses `StatusMessage` instead of `Body LIKE '%…%'`.
- `prompts.test.ts` asserts both points are in the guide.

## Why

Agents read "for exact match, use SQL" and mostly kept writing `ServiceName:x`, which matches `x-jobs` too and skips the primary key (one hour of logs: 108.9M vs 1.65M rows read). For body text, the descriptions pointed to `LIKE`, which can't use the index (27.7 GiB vs 121 MiB for the same matches). Details in #3538.

What each recommended form compiles to on `main`:

| Lucene | SQL |
|---|---|
| `ServiceName:api` | `ServiceName ILIKE '%api%'` |
| `ServiceName:"api"` | `ServiceName = 'api'` |
| `timeout` | `hasAllTokens(lower(Body), lower('timeout'))` (with a text index) |
| `"connection refused"` | `hasAllTokens(lower(Body), lower('connection refused')) AND lower(Body) LIKE lower('%connection refused%')` |
| `Body:"connection refused"` | `Body = 'connection refused'` |

The optional hint ("`ServiceName:api` matched 2 values") is not part of this PR; happy to follow up if you want it.

## Tests

- `npx jest src/mcp --testPathIgnorePatterns '\.int\.test\.ts$'` in `packages/api`: 25 suites, 484 tests pass.
- `tsc --noEmit`, `eslint` (no new warnings) and `prettier` clean.

Closes HDX-5774 Stacks on #3440

## Summary

Newer OTel browser SDKs no longer put network timing on fetch and XHR spans. They send one `browser.resource_timing` log per request instead, and the click that started the request is a separate log with no trace id. This draws the timing logs as dots on their spans, like the old SDK's span events, and adds a "Triggered by" row for the click. Old-SDK and backend traces are unchanged.

### Changes
- **Gate** (`hooks/useBrowserTraceEvents.ts`, `utils/browserTraceContext.ts`): both queries run only for traces with a `browser.document.url.full` span, when the correlated log source has Event Name, Event Attributes, Trace Id and Span Id expressions. They start after the waterfall loads and fail quietly.
- **Timing dots** (`utils/resourceTimingMarkers.ts`): `browser.resource_timing` logs are read by TraceId and drawn on their span through the existing span event markers, named like sdk-trace-web's events. The last dot's tooltip shows duration, sizes and protocol, since new-SDK spans don't carry the response size. Dots follow the **Span events** chip.
- **Timing rows**: once the dots load, the log rows they replace leave the waterfall and the log count, so they show for about one round trip first. They stay when the dots aren't visible (**Spans** or **Span events** off, a logs filter) or when the row is selected.
- **Triggered by** (`utils/traceTriggerClick.ts`): the latest `browser.user_action.click` with the same `session.id` and service in the 250 ms before the first browser span, shown first as "Triggered by: Clicked … · 3ms before". Clicking it opens the click log. It doesn't match on page URL: the SDK records the click's URL before the handler changes the route or query string.
- **Shared code**: E2's session log query parts move to `getSessionLogEventQueryParts` (`utils/sessionLogEvents.ts`) for the trigger query. E2's SQL is unchanged.

### Screenshots

Example of a browser event triggering this trace, along with timing events on the span:
<img width="1418" height="411" alt="Example of a browser event triggering this trace, along with timing events on the span" src="https://github.com/user-attachments/assets/3433d341-2b0c-4fc6-b3dd-cf06ad8f9585" />
… (#3534)

Closes HDX-5888

## Summary

Our new OTel JS SDKs send `exception.stacktrace` as raw text, so the exception panel showed a text block. This parses it into frames on `webjs`/`nodejs` rows and shows each `Caused by:` error as a collapsible section. Old `parsed_stacktrace` rows and other languages are unchanged. This is just a visual change to the exceptions panel.

### Changes
- **Parser**: Sentry's Chrome/Gecko line parsers, ported with the MIT notice. No new dependency.
- **Causes**: collapsed one-line rows that expand to their own frames. Full message with line breaks when open. These get stacked (the SDK limits it to 5 by default)
- **Frames**: library frames labeled "Library or framework code". No bare "in" on unnamed frames for when the parser/sourcemap can't find the parent func.

### Screenshots


#### Before

Old SDK error for example (as seen in traces browser). As you can see this is undisturbed and the old SDK works fine.
<img width="600" alt="old sdk error example" src="https://github.com/user-attachments/assets/9599bb90-f274-4102-a1b5-0d447c85c592" />


#### After

New Exceptions view panel (as seen on logs browser, where the SDKs send browser events)
<img width="600" alt="new view overall" src="https://github.com/user-attachments/assets/47e42116-5267-4fde-9c90-4b5d41af82cc" />

Raw stack trace (note the source maps used this data in the previous screenshot, and that caused by was parsed and separated)
<img width="600" alt="raw stack trace" src="https://github.com/user-attachments/assets/1eaf71e1-5c06-44bf-acae-ae34c0b78e66" />


When source maps are unavailable:

<img width="600" alt="example when source maps are unavailable" src="https://github.com/user-attachments/assets/94970212-714a-45d3-81ec-b766e985f6c5" />

When there's no a stack trace, only a message:
<img width="600" alt="example no stack trace" src="https://github.com/user-attachments/assets/dd413274-fa65-412c-a690-b56f3776075d" />
…ookups (#3603)

Co-authored-by: Karl Power <85935352+karl-power@users.noreply.github.com>

…3609)

## Summary

- Replaces `Divider` with `Separator` in sources list

### Screenshots or video


<img width="2340" height="580" alt="1-sources-list-compare" src="https://github.com/user-attachments/assets/c1941f06-6702-4faa-bf24-00bd754af537" />
<img width="2276" height="1943" alt="2-log-source-form-compare" src="https://github.com/user-attachments/assets/49bea79c-274f-4f25-aa58-6cd2f405f9cc" />
<img width="2276" height="2757" alt="3-trace-mv-source-form-compare" src="https://github.com/user-attachments/assets/b98393e4-30d8-4176-bad2-23611a736924" />

### How to test on Vercel preview


**Preview routes:** /team

**Steps:**

1. Open the Vercel preview. In onboarding, click Connect to Demo Server.
2. Go to /team in the address bar. The nav hides Team Settings in this mode. Then look at the lines between sources on the Data tab.
3. Open a log source with its chevron, and click Configure Optional Fields. Look at the lines between the field groups.
4. Open a trace source and look at the lines between its field groups. Click Add Materialized View to see the line under the materialized view settings.


## Summary
"Denoise results" on the search page often left noisy rows in the table. Three bugs caused it:
- **It mined the last table column, not the body.** `patternColumn = columns[columns.length - 1]`. Adding a column from the side panel appends it, so denoise switched to that attribute. An added map column carries an alias (`LogAttributes['k'] AS "k"`), and the alias was then used as a SQL expression in the sample query. Denoise now uses the source's body expression (`getEventBody`), finds its result column by position in the select list, and says so in the panel when the body isn't in the table.
- **ANSI-colored rows never matched.** Sampling strips ANSI codes; matching the visible rows didn't. In a local replay (drain3 wheel the app loads, 10k sampled rows, 200 visible rows), a colored template at ~27% of traffic had 0 of 54 rows removed. With this PR: 54 of 54.
- **Rows were re-matched with drain3's `match()`.** That needs an exact template fit and can put a row in a different cluster from the one it was counted in. The MCP denoise already replaced this with `buildNoisyBodyMatcher`. That matcher moves to `common-utils/src/drain/noisy-matcher.ts`, gains an `extraDelimiters` option so it tokenizes like the web miner, and is now used by both.
The denoise logic moves out of `DBRowTable.tsx` into `hooks/useDenoisedRows.ts` and `components/DenoiseSummary.tsx`. If the pattern query fails, the table now shows all rows instead of an empty table.
**Noise threshold: 10% → 5%.** A pattern counts as noisy when its cluster holds more than the threshold share of the 10k-row sample. Drain splits one logical pattern across clusters by token count and first token, so on the demo logs no cluster passed 10% (the top one was 9.2%) and denoise removed nothing. At 5%, the demo data's 6-hour window hides 6–7 patterns (the sample is random) covering about 45% of it. The threshold lives in `selectNoisyPatterns` (common-utils), shared by the app and the MCP `denoise` option, whose tool description is updated. The MCP integration test still passes.
**Errors and warnings are never hidden.** Frequency isn't importance: during an incident a flood of errors becomes the most common pattern. The app skips any pattern whose sampled lines include an error or warning (`getLogLevelClass`). The MCP denoise doesn't apply this yet, because its sample query doesn't select the level.
**Readable panel.** The raw template list is replaced by a one-line summary ("Hiding 6 common patterns, about 45% of events. Errors and warnings are never hidden.") with a "Show patterns" toggle. Each pattern is one truncated line with its share of events, and runs of wildcards collapse to `…` (`simplifyPattern`). Hover shows the full template.
### Screenshots or video
Demo Logs on the Vercel previews (`main` and this branch), same 6-hour window, "Denoise results" on.
| Before | After |
| :----- | :---- |
|  |  |
| "No noisy patterns found", nothing removed | Summary line; error rows still shown |
| |  |
| | "Show patterns" expanded |
### How to reproduce
**Starting point:** `yarn app:dev:local` connected to the demo server (onboarding → "Connect to Demo Server").
**On `main`:**
1. Open Search with the Logs source and turn on "Denoise results" in the filters panel.
2. Expand any row and add a log attribute as a column from the side panel.
3. Before step 2, the panel already reads "No noisy patterns found" and no rows are removed. After step 2, denoise mines that attribute instead of the body, or the table stays empty if the sample query fails.
**On this branch:**
1. Turn on "Denoise results". The panel reads "Hiding … common patterns, about …% of events…". Click "Show patterns" to see them (e.g. "Browsing product"); those rows are gone from the table, and error rows remain.
2. Repeat step 2 above. The removed patterns are still body patterns.
3. Remove the `Body` column from the select. The panel reads "Add Body to the table columns to denoise results." and all rows are shown.
### How to test on Vercel preview
**Preview routes:** /search
**Steps:**
1. Select the Logs source.
2. Turn on "Denoise results" in the filters panel.
3. Verify the text starting "Hiding" and ending "Errors and warnings are never hidden." appears above the results table.
4. Click "Show patterns" and verify a list of one-line patterns with percentages appears.
5. Change the select to `Timestamp, ServiceName` and run the search.
6. Verify the text "Add Body to the table columns to denoise results." appears and results are shown.
### References
- Linear Issue:
- Related PRs: #2371 (MCP denoise, which introduced `buildNoisyBodyMatcher`)
🤖 Generated with [Claude Code](https://claude.com/claude-code)
…ges (#3625)

## Summary

- Replace Mantine's `Divider` with click-ui's `Separator` on chart drawers and associated files

### Screenshots or video


<img width="940" height="970" alt="1-chart-display-settings-compare" src="https://github.com/user-attachments/assets/fdd0dad5-963b-4613-8fd6-a03ee811d912" />
<img width="940" height="602" alt="2-series-number-format-compare" src="https://github.com/user-attachments/assets/6c4971bb-84b7-4953-81ab-a8fbc85336a3" />
<img width="1300" height="344" alt="3-row-click-action-compare" src="https://github.com/user-attachments/assets/b15a795d-e73b-45e1-becd-ba24f81aa0a4" />
<img width="820" height="384" alt="4-heatmap-settings-compare" src="https://github.com/user-attachments/assets/7d532479-04f8-4d81-abd4-62dff4722881" />
<img width="1300" height="980" alt="5-filter-form-queried-values-compare" src="https://github.com/user-attachments/assets/042bca73-1175-40c2-8695-0885357fecc5" />
<img width="1300" height="845" alt="6-filter-form-ad-hoc-compare" src="https://github.com/user-attachments/assets/d8fd4dd6-574a-47f2-9b2d-e4c666365687" />

### How to test on Vercel preview


**Preview routes:**  /dashboards

**Steps:**

1. Go to Dashboards, create a dashboard, and add a tile. Open Display Settings, and then the series Edit display format → Custom. Look at the lines above the buttons.
2. Change the tile to Table and click Row Click Action. Look at the line above the buttons.
3. On the dashboard, open the filters and click Add filter. Look at the lines around "Broadcast filter condition" for "Queried values" and for "Ad hoc keys and values".
4. On Search, pick a trace source, open Event Deltas, and open the heatmap settings. Look at the line under "Y axis scale".
…r (#3626)

## Summary

Replace Mantine `Divider` with the click-ui `Separator` in keyboard shortcuts modal, What's new drawer, filter settings popover, metric explorer, Chart Explorer, time picker, and Service Map tooltip

### Screenshots or video


<img width="1300" height="1012" alt="1-keyboard-shortcuts-compare" src="https://github.com/user-attachments/assets/95be914c-35f0-4af5-9aa8-bf22d4a2f1a3" />
<img width="872" height="445" alt="2-whats-new-drawer-compare" src="https://github.com/user-attachments/assets/44cfeee7-2507-4854-8bc0-cd491e3fad97" />
<img width="560" height="193" alt="3-filter-settings-popover-compare" src="https://github.com/user-attachments/assets/7e3ff153-05fb-4e44-933d-4aa1ee4fd16d" />
<img width="1770" height="740" alt="4-metric-explorer-detail-compare" src="https://github.com/user-attachments/assets/56005281-ff4e-4c64-8125-61b3a5311973" />
<img width="2768" height="135" alt="5-chart-explorer-ai-assistant-compare" src="https://github.com/user-attachments/assets/be16d106-7813-4a90-a1fa-76db0c8da964" />
<img width="986" height="469" alt="6-time-picker-compare" src="https://github.com/user-attachments/assets/0134697e-a150-4f16-b87d-1805495389d1" />
<img width="750" height="282" alt="7-service-map-tooltip-dark-compare" src="https://github.com/user-attachments/assets/9c57c120-f655-42c2-9271-afb5a3bdad42" />
<img width="750" height="282" alt="7-service-map-tooltip-light-compare" src="https://github.com/user-attachments/assets/1592c3fc-13f1-4b8b-a271-b029c2d6e9b0" />

### How to test on Vercel preview


**Steps:**

1. Open Help → Keyboard shortcuts, and then Help → View all releases. Look at the lines between rows and between releases.
2. On Search, open Filter settings and the time picker. Look at the line under the title and the lines between the time range groups.
3. In a tile editor with a metric source, click Browse metrics. Look at the line under the metric name.
4. On Service Map, click a service, in light mode and in dark mode. Look at the lines in the tooltip.
Co-authored-by: github-actions[bot] <41898282+github-actions[bot]@users.noreply.github.com>
Co-authored-by: github-actions[bot] <github-actions[bot]@users.noreply.github.com>
## Summary

Upgrades ClickHouse from 26.8.36.3 to 26.10.3.7 and updates the tests that assumed the 26.8 TimeSeries layout. Needed for PromQL label lookups through ClickHouse's Prometheus HTTP API (26.9+).

- Pins `26.10.3.7` in the four compose files (incl. e2e) and the all-in-one `Dockerfile`.
- `metadata.int.test.ts`: pins the `getTimeSeriesTableColumns` tables to `version = 7` (26.10 defaults to version 8, which moves `min_time`/`max_time` out of the tags table), expects the renamed `metric_family` column, and adds `getTimeSeriesTableVersion` coverage.
- `timeseriesEngine.int.test.ts`: the version 8 suite fails instead of silently skipping.
- `seed-clickhouse.ts`: the e2e PromQL seed writes to `samples` (new tables have no `time_series` column).

No production code changes were needed. On an existing volume, `system.metric_log` history moves to `system.metric_log_0`. Local otel smoke tests need `clickhouse-client` 26.9+.

### References

- Linear Issue: part of HDX-5420
## Summary

`clickstack_service_health` no longer tells the agent whether a service is critical, degraded or healthy. A healthy service used to get "report this service as steady, no action needed". That verdict comes from service-wide totals, so a regression confined to one endpoint, pod or attribute segment can sit under every threshold while the tool tells the agent to stop looking. In the `deploy-regression` eval, main calls the service with the bug "Healthy".

Each service now carries only evidence:

| | Before | After |
|---|---|---|
| Per-service field | `status: critical / degraded / healthy` | removed; `flags` and `score` stay |
| Summary, nothing crossed | `Healthy: … normal variance; report this service as steady, no action needed.` | `No metric crossed a threshold vs yesterday: error rate 0.50% vs 0.49%, p95 120ms vs 115ms, requests 3000 vs 2900.` |
| Summary, threshold crossed | `CRITICAL: error rate 8.00% vs 0.50%.` | `Crossed thresholds: error rate 8.00% vs 0.50%.` |
| Report summary | `statusCounts: {critical, degraded, healthy}` | `servicesFlagged` |
| Ordering | status, then new errors, then score | threshold-flagged services, then the rest; within each, new or growing errors first, then score |
| Span attributes | `mcp.service_health.critical_count`, `degraded_count` | `mcp.service_health.flagged_count` |

The tool description and `usage` now say that thresholds apply to service-wide totals and point to `clickstack_table` breakdowns before a service is ruled out. "No flags is a valid result for a routine check" stays, so status reports are not pushed into escalating.

`statusCounts` and per-service `status` are gone from the response. Both are MCP output read by agents; nothing else in the repo consumes them.

## Evals

A/B with `packages/hdx-eval`: branch (slot 99) vs `main` (slot 98), both built from `02f6fd060`, identical seeded data, `claude-opus-4-6`.

| Scenario | Runs/arm | Branch | Main | Δ | Tool calls (branch / main) |
|---|---|---|---|---|---|
| `service-health-check` | 3 | 76% | 75% | +1 | 7.7 / 5.7 |
| `error-root-cause` | 3 | 99% | 98% | +1 | 10.3 / 9.0 |
| `segmented-regression` | 8 | 75.5% | 71.6% | +3.9 | 14.9 / 17.1 |
| `deploy-regression` | 8 | 70.3% | 74.6% | −4.3 | 15.6 / 13.9 |
| `quiet-saturation` | 8 | 84.3% | 88.8% | −4.5 | 19.1 / 16.8 |
| **Average** | | **81.0%** | **81.6%** | **−0.6** | |

The change is neutral on scores. Per-run spread within an arm is 15–20 points, so no difference is significant (the largest has t ≈ 1); `segmented-regression` went from −11 after 3 runs to +13 over the next 5. Routine checks did not get more alarmist: the judge scored `service-health-check` 8 points higher on the branch. Its regex false-alarm checks scored it lower, but they mostly match negated phrases such as "not ongoing" and "not escalation-worthy". Agents make a few more tool calls in most scenarios once the tool stops saying "no action needed".

### How to reproduce

**Starting point:** local full stack (`yarn dev`) with trace data, and an MCP client such as `npx @modelcontextprotocol/inspector` connected to the local MCP endpoint (see `MCP.md`).

**On `main`:**

1. Call `clickstack_list_sources` and copy a `kind: "trace"` source ID.
2. Call `clickstack_service_health` with `{ "sourceId": "<id>" }`.
3. Each service has a `status`, and steady services read "Healthy: … no action needed."

**On this branch:**

1. Repeat the call.
2. There is no `status` field. Summaries state the crossed thresholds or the current vs comparison values, and `summary.servicesFlagged` replaces `statusCounts`.

### How to test on Vercel preview

N/A — non-UI change.

### References

- Linear Issue: HDX-5877
- Related PRs: #3411 (added `clickstack_service_health`)
## Summary

`clickstack_save_webhook` and `clickstack_save_alert` now declare `openWorldHint: true`. Neither makes a network call during the tool call, but a saved webhook points at a third-party endpoint (Slack, incident.io, or any public URL with a templated body), and a saved alert sends requests to it on a schedule. Declaring them closed-world told MCP clients they could skip the extra review they give tools that reach outside the system. That review matters here: a prompt-injected agent could create a generic webhook to an attacker URL plus a frequently firing alert, and use them to exfiltrate telemetry.

Every other tool stays closed-world. `clickstack_delete_webhook` stays closed-world too, since deleting only stops deliveries. A new test pins the open-world set to exactly these two tools.

Flagged by an MCP tool-annotation compatibility check.

### How to reproduce

**Starting point:** local `yarn dev` (needs the API).

**On `main`:**

1. Call `tools/list` on the MCP server (`/api/mcp`).
2. `clickstack_save_webhook` and `clickstack_save_alert` report `annotations.openWorldHint: false`.

**On this branch:**

1. Same call: both report `openWorldHint: true`, and all other tools still report `false`.
2. `cd packages/api && yarn ci:unit src/mcp/__tests__/toolAnnotations.test.ts` passes.

### Notes

Committed with `--no-verify`. lint-staged passed. The hook's knip step fails on an issue already on `main`: `@opentelemetry/browser-sdk` is declared in `packages/app/package.json` (added in #3575) but never imported.

Bumps [hono](https://github.com/honojs/hono) from 4.13.13 to 4.13.16. e notes</summary> <p><em>Sourced from <a href="https://github.com/honojs/hono/releases">hono's releases</a>.</em></p> <blockquote> <h2>v4.13.16</h2> <h2>Security fixes</h2> <p>This release includes fixes for the following security issues:</p> <h3><code>mount()</code> and <code>app.mount()</code> can forward a path that bypasses middleware scoped inside the mount prefix</h3> <p>Affects: <code>mount()</code> in <code>hono/mount</code> and <code>app.mount()</code>. A dynamic prefix such as <code>/api/:tenant/*</code> was removed by the length of the route pattern. The forwarded path was also re-normalized by the URL parser, so a decoded <code>\</code> became <code>/</code> and <code>..</code> collapsed. Both let a crafted request skip middleware scoped inside the mount prefix. Routes such as <code>/assets*</code> and duplicate parameter names now throw. GHSA-4m76-xfj5-7975</p> <h3>RegExpRouter skips wildcard middleware for certain route patterns and for paths with an encoded line terminator</h3> <p>Affects: <code>RegExpRouter</code>, including the default <code>SmartRouter</code>. Wildcard middleware was not applied in three cases: a parameter written as <code>{[^/]+}</code> in the middleware path only, a <code>/prefix*</code> route next to <code>/prefix/*</code> middleware, and a path with an encoded line terminator. RegExpRouter now covers the same routes as the other routers. Custom patterns that can match the empty string, such as <code>{[0-9]*}</code>, throw <code>UnsupportedPathError</code>. Regenerate <code>PreparedRegExpRouter</code> data. GHSA-h7mg-cq63-vhpq</p> <h3><code>validator('form')</code> skips validation for <code>multipart/form-data</code> requests with extra parameters</h3> <p>Affects: <code>validator('form')</code> in <code>hono/validator</code>. A <code>multipart/form-data</code> request with an extra parameter such as <code>charset</code> was not recognized as a form. The validator then saw an empty object while the handler could read all fields. GHSA-4h7h-rv7c-7m2v</p> <h3><code>css</code> helper does not escape a closing tag assembled from template parts and values, allowing HTML injection</h3> <p>Affects: <code>css</code> in <code>hono/css</code>. A <code></style></code> split between the template and a value, or between two values, was not escaped. Closing tags are now escaped after minification. GHSA-3gg2-335m-rxc6</p> <h3><code>csrf()</code> does not check requests sent by hyperlink auditing (<code>text/ping</code>)</h3> <p>Affects: <code>csrf()</code> in <code>hono/csrf</code>. A POST sent by Chromium's <code><a ping></code> has the content type <code>text/ping</code> and was not checked against <code>Origin</code> and <code>Sec-Fetch-Site</code>. GHSA-46wx-v44x-9hh2</p> <hr /> <p>Users who rely on path-scoped middleware with <code>mount()</code>, wildcard middleware with the default router, <code>validator('form')</code>, the <code>css</code> helper with untrusted values, or <code>csrf()</code> are strongly encouraged to upgrade to this version.</p> <h2>What's Changed</h2> <ul> <li>fix(jwt): reject a signature segment outside the base64url alphabet and a header with <code>crit</code> in <a href="https://redirect.github.com/honojs/hono/pull/5597">honojs/hono#5597</a></li> </ul> <p><strong>Full Changelog</strong>: <a href="https://github.com/honojs/hono/compare/v4.13.15...v4.13.16">https://github.com/honojs/hono/compare/v4.13.15...v4.13.16</a></p> <h2>v4.13.15</h2> <h2>What's Changed</h2> <ul> <li>fix(auth): escape backslashes in the WWW-Authenticate realm by <a href="https://github.com/yusukebe"><code>@yusukebe</code></a> in <a href="https://redirect.github.com/honojs/hono/pull/5590">honojs/hono#5590</a></li> <li>docs(contributing): drop the note about linking a fork branch by <a href="https://github.com/yusukebe"><code>@yusukebe</code></a> in <a href="https://redirect.github.com/honojs/hono/pull/5593">honojs/hono#5593</a></li> <li>fix(context): allow <code>c.header()</code> after the response body is consumed by <a href="https://github.com/yusukebe"><code>@yusukebe</code></a> in <a href="https://redirect.github.com/honojs/hono/pull/5587">honojs/hono#5587</a></li> </ul> <p><strong>Full Changelog</strong>: <a href="https://github.com/honojs/hono/compare/v4.13.14...v4.13.15">https://github.com/honojs/hono/compare/v4.13.14...v4.13.15</a></p> <h2>v4.13.14</h2> <h2>What's Changed</h2> <ul> <li>docs(contributing): ask for issues instead of RPs <a href="https://redirect.github.com/honojs/hono/pull/5526">honojs/hono#5526</a></li> <li>docs(readme): sync the contributing list with CONTRIBUTING.md <a href="https://redirect.github.com/honojs/hono/pull/5527">honojs/hono#5527</a></li> <li>fix(adapters): accept Hono v5 prereleases in the <code>hono</code> peer range <a href="https://redirect.github.com/honojs/hono/pull/5537">honojs/hono#5537</a></li> <li>chore: unified oxfmt and oxlint config <a href="https://redirect.github.com/honojs/hono/pull/5518">honojs/hono#5518</a></li> <li>docs(readme): remove the deepwiki badge <a href="https://redirect.github.com/honojs/hono/pull/5548">honojs/hono#5548</a></li> </ul> <!-- raw HTML omitted --> </blockquote> <p>... (truncated)</p> </details> <details> <summary>Commits</summary> <ul> <li><a href="https://github.com/honojs/hono/commit/c91b60a251186fb024557c6d55a11d8e388f179c"><code>c91b60a</code></a> 4.13.16</li> <li><a href="https://github.com/honojs/hono/commit/e1dd58856eea8c3e91494ca6a12578325b01cf46"><code>e1dd588</code></a> fix(jwt): reject a signature segment outside the base64url alphabet and a hea...</li> <li><a href="https://github.com/honojs/hono/commit/bf16471913b5199212dac33f5d170f94745dd26a"><code>bf16471</code></a> Merge commit from fork</li> <li><a href="https://github.com/honojs/hono/commit/d88fab372415277a9e540e895650943dd08eef4a"><code>d88fab3</code></a> Merge commit from fork</li> <li><a href="https://github.com/honojs/hono/commit/34f90432a1794b28e52802670efcd01963f716d6"><code>34f9043</code></a> Merge commit from fork</li> <li><a href="https://github.com/honojs/hono/commit/8a103aa59bcfbffd5396b1548a0dff3688777c36"><code>8a103aa</code></a> Merge commit from fork</li> <li><a href="https://github.com/honojs/hono/commit/15bbd96ad1b62a0b189db4fd8dc7bf8ef280c513"><code>15bbd96</code></a> Merge commit from fork</li> <li><a href="https://github.com/honojs/hono/commit/3cb29de8f110654c37aa9b4c7eccdeae5254f5f2"><code>3cb29de</code></a> 4.13.15</li> <li><a href="https://github.com/honojs/hono/commit/17ad0e21f5a91c939eeafa3df05793a8ea60f016"><code>17ad0e2</code></a> fix(context): allow <code>c.header()</code> after the response body is consumed (<a href="https://redirect.github.com/honojs/hono/issues/5587">#5587</a>)</li> <li><a href="https://github.com/honojs/hono/commit/ee88684625077a2cd0e2f4613e593e2635ffe4c7"><code>ee88684</code></a> docs(contributing): drop the note about linking a fork branch (<a href="https://redirect.github.com/honojs/hono/issues/5593">#5593</a>)</li> <li>Additional commits viewable in <a href="https://github.com/honojs/hono/compare/v4.13.13...v4.13.16">compare view</a></li> </ul> </details> <br /> [](https://docs.github.com/en/github/managing-security-vulnerabilities/about-dependabot-security-updates#about-compatibility-scores) Dependabot will resolve any conflicts with this PR as long as you don't alter it yourself. You can also trigger a rebase manually by commenting `@dependabot rebase`. [//]: # (dependabot-automerge-start) [//]: # (dependabot-automerge-end) --- <details> <summary>Dependabot commands and options</summary> <br /> You can trigger Dependabot actions by commenting on this PR: - `@dependabot rebase` will rebase this PR - `@dependabot recreate` will recreate this PR, overwriting any edits that have been made to it - `@dependabot show <dependency name> ignore conditions` will show all of the ignore conditions of the specified dependency - `@dependabot ignore this major version` will close this PR and stop Dependabot creating any more for this major version (unless you reopen the PR or upgrade to it yourself) - `@dependabot ignore this minor version` will close this PR and stop Dependabot creating any more for this minor version (unless you reopen the PR or upgrade to it yourself) - `@dependabot ignore this dependency` will close this PR and stop Dependabot creating any more for this dependency (unless you reopen the PR or upgrade to it yourself) You can disable automated security fix PRs for this repo from the [Security Alerts page](https://github.com/ClickHouse/ClickStack/network/alerts). </details>
This PR was opened by the [Changesets release](https://github.com/changesets/action) GitHub action. When you're ready to do a release, you can merge this and the packages will be published to npm automatically. If you're not ready to do a release yet, that's fine, whenever you add more changesets to main, this PR will be updated.


# Releases
## @hyperdx/api@2.45.0

### Minor Changes

- 2d17de5: feat: serve PromQL label lookups from ClickHouse's Prometheus HTTP API

  On ClickHouse 26.9+ with the `prometheus_api_v1` handler, `/labels` and `/label/:name/values` for a ClickHouse-backed PromQL source now proxy to the handler instead of querying the TimeSeries tags table with SQL. Older servers, servers without the handler, and sources set to `table-function` keep the SQL path, so a source that runs queries over HTTP on 26.6-26.8 still gets label autocomplete.

- db4e7ba: chore: upgrade bundled ClickHouse to 26.10.3.7

  The all-in-one image and the Docker Compose files now use
  `clickhouse/clickhouse-server:26.10.3.7-alpine`. New TimeSeries tables default
  to schema version 8, which keeps each series' time range in a separate inner
  table; existing tables keep their layout. `system.metric_log` switches to the
  bucketed schema, and rows from before the upgrade move to `system.metric_log_0`.

### Patch Changes

- c17fc16: fix: `{{note}}` in webhook bodies now contains the alert's note when the alert
  fires, not only in "Send test"
- 1fba1c3: fix: mark the MCP `clickstack_save_webhook` and `clickstack_save_alert` tools as open-world

  Saved webhooks and alerts send HTTP requests to third-party endpoints, so both tools now declare `openWorldHint: true`.

- 7b03880: feat: read the MCP PromQL label catalog from ClickHouse's Prometheus HTTP API

  `describe_source` on a ClickHouse-backed PromQL source now lists label and metric names through the `prometheus_api_v1` handler on ClickHouse 26.9+, and falls back to SQL on older servers, servers without the handler, and sources set to `table-function`.

- ac913ce: feat: Choose how a PromQL source on ClickHouse is evaluated (the Prometheus HTTP API or the `prometheusQuery` table functions) instead of probing the server on every query. Without a choice the server is still probed, but the answer is now kept for 5 minutes. A source set to the HTTP API against a server that does not serve it fails with a clear error. Onboarding pins a PromQL source it detects to the HTTP API when the server serves it.
- 7cfd333: fix(mcp): drop the health verdict from clickstack_service_health

  The tool no longer labels services critical, degraded or healthy, and no longer
  tells agents a service needs "no action". Each service keeps its threshold
  flags, score and a factual summary, so agents reason from the numbers instead of
  a verdict that service-wide totals can get wrong. `summary.statusCounts` is
  replaced by `summary.servicesFlagged`, and the span attributes
  `mcp.service_health.critical_count` and `mcp.service_health.degraded_count` are
  replaced by `mcp.service_health.flagged_count`.

- Updated dependencies [2d17de5]
- Updated dependencies [ac913ce]
  - @hyperdx/common-utils@0.35.0
## @hyperdx/app@2.45.0

### Minor Changes

- b3cbd02: feat: split the service map by up to 3 extra group-by SQL expressions (for
  example `ResourceAttributes['k8s.pod.name']`), so a node is a service plus
  those values and a slow or failing pod is no longer averaged into its service.

### Patch Changes

- ac913ce: feat: Choose how a PromQL source on ClickHouse is evaluated (the Prometheus HTTP API or the `prometheusQuery` table functions) instead of probing the server on every query. Without a choice the server is still probed, but the answer is now kept for 5 minutes. A source set to the HTTP API against a server that does not serve it fails with a clear error. Onboarding pins a PromQL source it detects to the HTTP API when the server serves it.
- Updated dependencies [c17fc16]
- Updated dependencies [1fba1c3]
- Updated dependencies [7b03880]
- Updated dependencies [2d17de5]
- Updated dependencies [ac913ce]
- Updated dependencies [7cfd333]
- Updated dependencies [db4e7ba]
  - @hyperdx/api@2.45.0
  - @hyperdx/common-utils@0.35.0
## @hyperdx/common-utils@0.35.0

### Minor Changes

- 2d17de5: feat: serve PromQL label lookups from ClickHouse's Prometheus HTTP API

  On ClickHouse 26.9+ with the `prometheus_api_v1` handler, `/labels` and `/label/:name/values` for a ClickHouse-backed PromQL source now proxy to the handler instead of querying the TimeSeries tags table with SQL. Older servers, servers without the handler, and sources set to `table-function` keep the SQL path, so a source that runs queries over HTTP on 26.6-26.8 still gets label autocomplete.

### Patch Changes

- ac913ce: feat: Choose how a PromQL source on ClickHouse is evaluated (the Prometheus HTTP API or the `prometheusQuery` table functions) instead of probing the server on every query. Without a choice the server is still probed, but the answer is now kept for 5 minutes. A source set to the HTTP API against a server that does not serve it fails with a clear error. Onboarding pins a PromQL source it detects to the HTTP API when the server serves it.
## @hyperdx/otel-collector@2.45.0

Moves the fork to @hyperdx/app@2.45.0.

Upstream dropped its selectable brand themes for one ClickStack brand. Three swapped references supply the DFE name, marks and palette. brand/index.tsx and ThemeWrapper.tsx read dfe/brand.tsx. theme/_base-tokens.scss uses the DFE tokens.

The seven workflows in .fork-deleted stay deleted. LOCAL.md, UserPreferencesModal.tsx and utils.ts match upstream again. The fork's changes were formatting or behaviour upstream has adopted. SECURITY.md and README.md keep the fork's versions.
…am pin

The pin moves to @hyperdx/app@2.45.0. Upstream pins systeminformation at ^5.33.19 and resolves mongoose 6.13.12. Both register entries are removed. The follow-redirects and body-parser register entries stay.
The upstream merge left custom.config.yaml identical to upstream.
Only DBServiceMapPage.tsx uses ServiceMapGroupByInput.tsx. This fork does not route DBServiceMapPage.tsx. The knip ignore entry changes from the deleted theme/index.ts to ServiceMapGroupByInput.tsx.

The DFE brand name constant is no longer exported.

dfeTheme.test.ts joins __dirname with literal paths, as forkDeltas.test.ts does. theme/index.ts is gone, so its entry no longer matches anything.
Upstream removed the theme switch, so no code reads the variable the Dockerfile sets.
…store

Six fork integration suites dropped the database straight after connect. Dropping during an index build deadlocks on DocumentDB. team-connection-recheck failed that way on this PR.

The suites share dropTestStore. It waits for every model init before dropping, as closeDB in fixtures.ts does.


Contributor
|
Released in v0.3.26 -- https://github.com/hyperi-io/dfe-hyperdx/releases/tag/v0.3.26 |
This file contains hidden or bidirectional Unicode text that may be interpreted or compiled differently than what appears below. To review, open the file in an editor that reveals hidden Unicode characters.
Learn more about bidirectional Unicode characters
Sign up for free
to join this conversation on GitHub.
Already have an account?
Sign in to comment











Add this suggestion to a batch that can be applied as a single commit.This suggestion is invalid because no changes were made to the code.Suggestions cannot be applied while the pull request is closed.Suggestions cannot be applied while viewing a subset of changes.Only one suggestion per line can be applied in a batch.Add this suggestion to a batch that can be applied as a single commit.Applying suggestions on deleted lines is not supported.You must change the existing code in this line in order to create a valid suggestion.Outdated suggestions cannot be applied.This suggestion has been applied or marked resolved.Suggestions cannot be applied from pending reviews.Suggestions cannot be applied on multi-line comments.Suggestions cannot be applied while the pull request is queued to merge.Suggestion cannot be applied right now. Please check back later.
Merges hyperdxio/hyperdx at 0096a35 (@hyperdx/app@2.45.0). Closes #224.
28 conflicts could not be replayed by rerere.
Upstream's single-brand change, af17e8f, deleted the theme registry the DFE theme plugged into. DFE branding uses three references:
brand/index.tsx takes the name and marks from dfe/brand.tsx
ThemeWrapper.tsx takes its Mantine theme from dfe/brand.tsx
theme/_base-tokens.scss uses the DFE tokens, emitted unscoped
jest pins DFE_UPSTREAM_BRAND, so upstream's tests still see ClickStack
_document.tsx links the DFE favicons
the seven workflows in .fork-deleted stay deleted
LOCAL.md, UserPreferencesModal.tsx, utils.ts and custom.config.yaml match upstream again
Those files leave .fork-surface
README.md and SECURITY.md keep ours
SECURITY.md joins .fork-surface
docker-compose.ci.yml takes ClickHouse 26.10.3.7, pinned by digest
useRowWhere.tsx takes upstream's SHA256 hash and keeps our JSON normalisation
the systeminformation and mongoose pins are removed because upstream covers both
This needs a merge commit. A squash drops the upstream parent, and the pin check then fails.
The DFE palette and marks have not been checked in a browser.