A Java-based data visualization tool for analyzing historical and forecasted food price trends using CPI and PPI data. This application connects to a MySQL database and provides interactive charts and tables to support economic insights.
Before you can run the Price Visualizer application, you must install a Database Management Software (DBMS). We will be using MySQL, which requires two components:
- MySQL Workbench – A GUI to interface with the database
- MySQL Server – The actual database server running locally on your machine
Download the MySQL Workbench for Windows from the following link:
- Choose your operating system (Windows) from the drop-down menu.
- Follow the installation instructions provided.
- This GUI tool will allow you to run queries, visualize schema, and manage your database easily.
Download the MySQL Server using the MySQL Installer:
- Select the "Developer Default" option during installation to include the necessary tools.
- When prompted, choose a simple password for the root user (e.g.,
pass).⚠️ Important: Don’t forget this password. You’ll need it to connect the Java application to the database.- This server will run locally and is not internet-accessible, so security complexity is not necessary.
For a complete visual guide of this step, follow this video tutorial created by John Mattox:
👉 Installation Video
Once MySQL Workbench and Server are installed, follow these steps to set up your database schema and import the project data.
- Open MySQL Workbench and start the local MySQL server.
- Go to
File > New Query Tab. - In the editor, paste the following SQL command:
CREATE SCHEMA foodprices;
- Click the ⚡ (lightning bolt) icon to run the command.
- Click the gray refresh arrow next to Schemas.
- You should now see a new schema named foodprices.
- Right click the schema and click 'Set as Default Schema'


- Download the repository as a .zip file. Extract the folder in any place. This tutorial will assume it's in the Downloads folder.
- Navigate to the following folder in your file explorer:
Price-Visualizer-master/Price-Visualizer-master/sql/automaticSetup.sql - Open
automaticSetup.sqland copy all theCREATE TABLEstatements inside. - Go back to your MySQL Workbench window (this should you have CREATE SCHEMA command at the top) and make sure the
foodpricesschema is bolded. - Paste the copied SQL commands into the query editor at the top.
- Highlight all the
CREATE TABLEcommands and click the ⚡ (lightning bolt) icon to run them.

Hit the refresh arrow in schemas and your tables should look like this:

-
Open Command Prompt.
-
Use
cdto navigate to the MySQL binary directory:- You can find it by launching MySQL, opening Task Manager, right-clicking on MySQL Workbench, and selecting Open file location.
- Example path:
cd "C:\Program Files\MySQL\MySQL Workbench 8.0 CE"
-
Launch the MySQL CLI with file loading enabled:
mysql --local_infile=1 -u root -p -
Enter your password (e.g.,
pass). -
Enable file loading
set global local_infile=true; -
Select your schema:
USE foodprices;
-
Go back to the file explorer and double click load_all_data.sql. This should open mySQLWorkbench.
-
You'll notice each table has "LOAD DATA LOCAL INFILE" then a path to a .csv. Make sure you change the path for each LOAD DATA query. All the data tables can be found in the /dataset folder.
- 💡Tip: Right click on each CSV and click 'Copy as Path'. Paste that into the SQL file. From there, you can use that path for the rest of the CSVs. Make sure any backslashes (\) are changed to forwardslashes (/)!
- If your file path is similar to mine, feel free to use this template...
'C:/Users/[YOUR USERNAME]/Downloads/Price-Visualizer-master/Price-Visualizer-master/dataset/[datatable-name].csv'
- Once all of the paths are correct, press Ctrl+S to save. This should update the load_all_data.sql file in the folder. Yours should look similar to the image below...

- To load the data, run the following in command prompt:
SOURCE C:\Users\[YOUR USERNAME]\Downloads\Price-Visualizer-master\Price-Visualizer-master\sql\load_all_data.sql- Make sure to adjust the path if your SQL file is in a different location.
- 💡 Tip: once you navigate to the load_all_data.sql file, right click and click "Copy as Path". You can use this in front of SOURCE.
- This script contains all
LOAD DATA LOCAL INFILEcommands to populate your tables from CSV files. - If everything is correct, you should see 8 lines that say 'QUERY OK'.

You can check if this worked by going back to your local instance of MySQL and clicking refresh, hovering over a table, and clicking the little lightning bolt in the window.

There should be data shown in the table. Now we're ready to continue with the rest of the setup!
- Go back to the file explorer and open the
automaticSetup.sqlfile again. - Scroll down until you see the comment:
-- START OF IDCreation.sql -- - Copy everything from that line to the end of the file.
- Return to your SQL tab in MySQL Workbench — the same one where you created the schema and tables.
- Paste the copied SQL below your existing
CREATE TABLEstatements. - Highlight all the newly pasted lines and click the ⚡ (lightning bolt) icon to execute them.

📌 This will:
- Add primary keys to each table
- Rename columns to be more SQL-friendly
- Create a query history table for tracking your SQL execution
None of the original datasets contained natural primary keys-- the values in columns like Aggregate, Disaggregate, or Attribute were often repeated, nullable, or not guaranteed to be unique. This made it impossible to uniquely identify rows, which is essential for reliable data manipulation, joining, and referencing.
To resolve this, we added an AUTO_INCREMENT primary key (e.g., cpiforecast_id, ppiforecast_id, etc.) to every table. This had several purposes specific to this project:
- ✅ Normalization: Assigning a unique ID to each row ensures that we follow best practices in relational database design. It also allows for future decomposition into related tables without relying on ambiguous composite keys.
- 🔗 Reliable joins: Many of our queries (as seen in
tableQueries.sql) involve filtering or aggregating rows across multiple datasets. Having a unique ID allows for clean and efficient joins or references between tables. - 📊 Query tracking and logging: The
query_historytable we created references specific queries. Having IDs on each source table supports tracking which rows were accessed or transformed during each logged query. - 🛠️ Data safety: With auto-incrementing IDs, even if multiple rows contain identical data (e.g., two rows with the same item and forecast value), we can still identify and manipulate each row independently without conflict.
In short, adding AUTO_INCREMENT IDs was a structural improvement that enabled normalization, future-proofed our design, and supported the advanced querying work seen in this project.
The GUI for Price Visualizer is written in Java and requires Java 17 to be installed on your system.
-
Go to the official Temurin Java download page:
👉 https://adoptium.net/en-GB/temurin/releases/?version=17 -
Under Temurin 17, select:
- Operating System:
Windows - Architecture:
x64(most systems) - Package Type:
MSI Installer
- Operating System:
-
Click Download and run the installer.
-
During installation:
- ✔️ Make sure "Set JAVA_HOME environment variable" is checked.
- ✔️ Ensure the PATH variable is updated so you can run
javafrom the command line.
-
To confirm the installation worked:
- Open Command Prompt
- Type:
java -version
- You should see output that starts with something like:
openjdk version "17.0.x"
📌 Once Java is installed, you’ll be able to launch the GUI using the included .bat file (instructions to follow next).
Once Java 17 is installed and your database is fully set up, you can launch the Price Visualizer application using the provided batch file.
-
Open File Explorer and navigate to the project directory:
Price-Visualizer-master/Price-Visualizer-master/ -
Look for a file named:
runVisualizer.bat -
Double-click the
.batfile to run the application.
💡 If the terminal flashes and disappears, try running it via Command Prompt:
- Open Command Prompt
- Navigate to the folder:
cd C:\Users\[YOUR USERNAME]\Downloads\Price-Visualizer-master\Price-Visualizer-master - Then run:
runVisualizer.bat
- The Java application will launch with a GUI window.
- You should see a dropdown menu, query options, and a table/chart panel.
- If you get a database connection error, double-check that:
- Your MySQL server is running
- The username is
rootand password ispass(or whatever you set). This can be found if you open PriceDataVisualizer.java (src/main/java/org/FinalProject/PriceDataVisualizer.java) and look iin setupConnectionPool(); -

- The schema
foodpricesexists and contains the expected tables
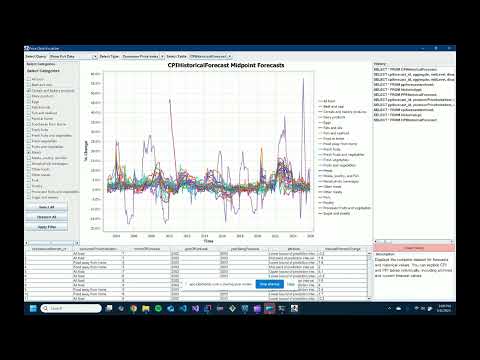
If everything worked correctly, this should be the window that pops up...

This project utilizes the following open-source libraries:
-
HikariCP
- Purpose: Efficient connection pooling for MySQL database access.
- Source: https://github.com/brettwooldridge/HikariCP
-
JFreeChart
- Purpose: Creating charts and visualizations including time series and bar charts.
- Source: https://www.jfree.org/jfreechart/
-
MySQL Connector/J
- Purpose: JDBC driver for connecting Java applications to MySQL databases.
- Source: https://dev.mysql.com/downloads/connector/j/
-
Java Swing
- Purpose: GUI framework for building the user interface of the application.
- Source: Part of the standard Java Development Kit (JDK)
-
Food Price Outlook Dataset
- Purpose: Core dataset used for all querying, analysis, and visualization within the application.
- Source: USDA Economic Research Service – Food Price Outlook
All external libraries are either bundled with the project or should be included via Maven or manual JAR management.
The Price Visualizer application includes a variety of powerful features that help you interact with and analyze food price data effectively. Below is a complete list of every core feature and how to use it:
- What it does: Displays raw data from any CPI or PPI table in tabular and chart form.
- How to use:
- Select "Show Full Data" from the Query dropdown.
- Choose either Consumer Price Index or Producer Price Index.
- Use the Table dropdown to select a dataset (e.g.,
CPIForecast,historicalppi,cpiforecastarchived, etc.). - The table appears below, and if applicable, a time series chart is generated.
- Use checkboxes on the left to filter which items appear in the chart.
- Use Select All / Deselect All / Apply Filter buttons to manage checkboxes.
- What it does: Visualizes 2025 CPI/PPI forecast bounds for each item.
- How to use:
- Choose "Show Full Data" and select
CPIForecastorPPIForecast. - The bar chart will automatically load forecast bounds (Lower & Upper) for 2025.
- Use the left-hand checkboxes to include/exclude specific categories.
- Choose "Show Full Data" and select
- What it does: Measures volatility using average annual percent change for each category through the use of embedded SQL.
- How to use:
- Select "Volatility" from the Query dropdown.
- Choose CPI or PPI.
- Set the Year Range using the two spinners.
- Click Run Query to generate the volatility chart and table.
- Use checkboxes to filter items from the chart and table.
- Click Apply Filter to refresh the view based on your selections.
- What it does: Compares forecasted vs. actual values using mean absolute error.
- How to use:
- Select "Forecast Accuracy" from the Query dropdown.
- Choose CPI or PPI.
- Click Run Query.
- A line chart and table will show the average forecast error per category and year.
- Use checkboxes to explore trends for specific items.
- What it does: Compares archived vs. updated forecast models for CPI and PPI.
- How to use:
- Select "Methodology Comparison".
- Choose CPI or PPI.
- Click Run Query.
- A time series chart will show both forecasts (old and new) per item.
- Use the left-hand checkboxes to control which categories are shown.
- What it does: Logs every query you've executed.
- How to use:
- View the History panel on the right side of the window.
- Click on any previous query to re-run it and display the result.
- Click Clear History to remove all logs.
- What it does: Provides dynamic control over which data series appear in charts.
- How to use:
- Use checkboxes on the left-hand panel to select or deselect categories.
- Click Apply Filter to update both the chart and the table.
- Use Select All or Deselect All to quickly manage selections.
- What it does: Displays query results in a scrollable, export-friendly format.
- How to use:
- Scroll through rows in the lower section of the application window.
- You can copy-paste or export this data manually for further use.
This feature set was designed to make food price data more transparent, explorable, and insightful for analysis.
🔗 Click the image to watch the video! This will redirect you off of GitHub to Youtube.
├── price_visualizer_extracted/
│   ├── Price-Visualizer-master/
│   │   ├── .gitignore
│   │   ├── README.md
│   │   ├── pom.xml
│   │   ├── runVisualizer.bat
│   │   ├── .idea/
│   │   │   ├── .gitignore
│   │   │   ├── encodings.xml
│   │   │   ├── misc.xml
│   │   │   ├── vcs.xml
│   │   ├── dataset/
│   │   │   ├── CPIForecast.csv
│   │   │   ├── CPIForecast_Archived.csv
│   │   │   ├── CPIHistoricalForecast.csv
│   │   │   ├── PPIForecast.csv
│   │   │   ├── PPIForecast_Archived.csv
│   │   │   ├── PPIHistoricalForecast.csv
│   │   │   ├── historicalcpi.csv
│   │   │   ├── historicalppi.csv
│   │   ├── documentation/
│   │   │   ├── CSE385 - ADP1.pdf
│   │   │   ├── Price-Visualizer-Demonstration.mp4
│   │   │   ├── PriceVisualizer.drawio.pdf
│   │   │   ├── PriceVisualizer.drawio.xml
│   │   ├── sql/
│   │   │   ├── IDCreation.sql
│   │   │   ├── automaticSetup.sql
│   │   │   ├── columnFormatting.sql
│   │   │   ├── historyTableCreation.sql
│   │   │   ├── load_all_data.sql
│   │   │   ├── tableCreation.sql
│   │   │   ├── tableQueries.sql
│   │   ├── src/
│   │   │   ├── main/
│   │   │   │   ├── java/
│   │   │   │   │   ├── org/
│   │   │   │   │   │   ├── FinalProject/
│   │   │   │   │   │   │   ├── PriceDataVisualizer.java