An out-of-band auditor that proves whether your OpenTelemetry pipeline actually delivered what it claims to.


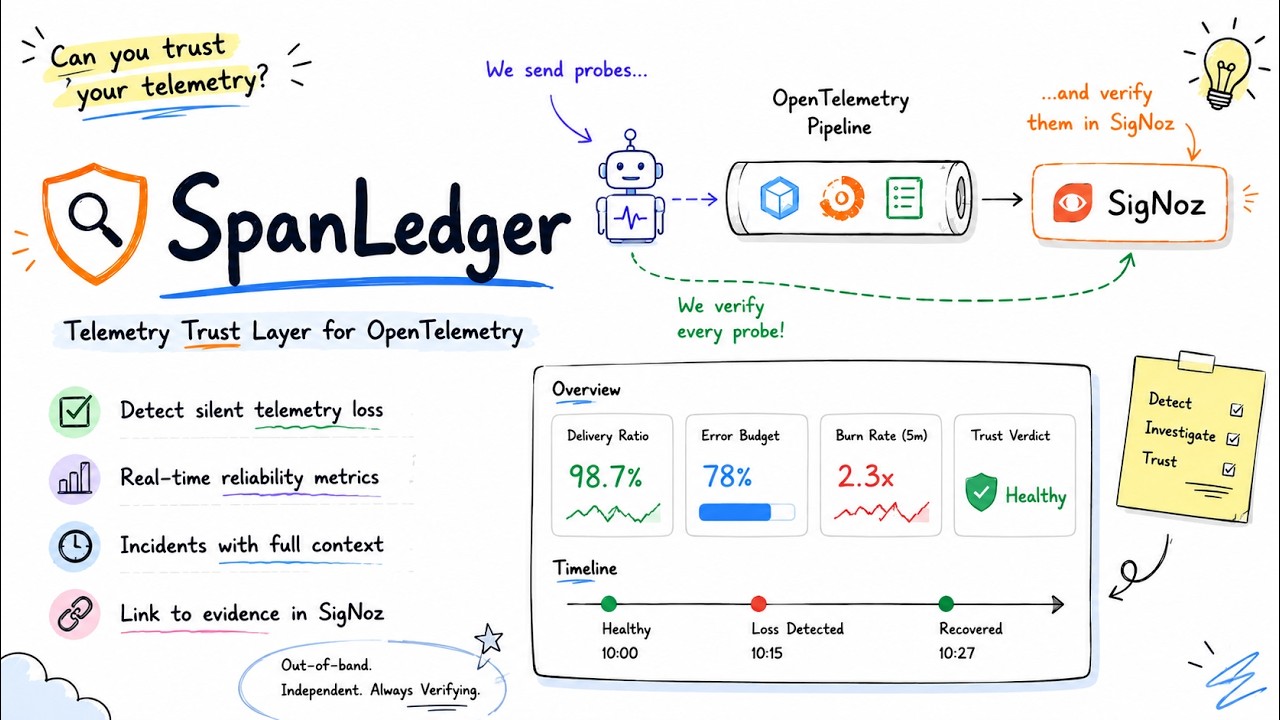
Dashboards, alerts, and APM tools all share one blind spot: they assume the telemetry reaching them is complete. A full exporter queue, a dropped batch, or a silent gateway outage produces exactly the same signal as "nothing happened": an empty query result. Nothing downstream of the loss can tell the difference, because by the time a trace, log, or metric is missing, there is nothing left to observe.
That gap matters most when telemetry is used to reason about a system rather than just chart it. An SRE debugging a latency spike, or an AI agent asked "why are my traces missing?", will happily draw a confident conclusion from an incomplete window of data, because incomplete telemetry doesn't announce itself as incomplete. It just looks like a quiet period.
SpanLedger closes that gap directly. It injects sequence-numbered probe signals into your pipeline's real entry points, verifies their arrival independently against SigNoz, and reports delivery ratio, loss onset, and gap forensics, entirely out-of-band, with zero changes to the pipeline being audited. The result is a trust verdict any human or agent can check before trusting a window of telemetry, not after being misled by it.
- Independent verification: probes are confirmed against SigNoz's Query API v5, never inferred from the pipeline's own view of what it sent.
- Never over-reports loss: an epoch model and a finalization watermark bias every
uncertain verdict toward
unknown, neverlost. - Built-in SLOs: error budget and multi-window burn rate (5m/1h/6h/3d) per stream/signal, no separate tooling required.
- MCP-native trust layer:
spanledger_check_telemetry_trustlets an agent check a time window before reasoning about gaps in it. - CI-gateable:
spanledger checkexits non-zero on induced loss, for use as a pipeline release gate. - Deploy-correlated dashboards: matching SigNoz dashboards and alert rules render straight from your config.
SpanLedger doesn't replace SigNoz; it audits the pipeline that feeds it.
| SigNoz | SpanLedger |
|---|---|
| Stores and queries telemetry | Verifies telemetry integrity |
| Shows the traces/logs/metrics it received | Detects the ones it never received |
| Observability platform | Trust layer in front of observability |
| Trusts whatever arrives | Independently confirms what was sent actually arrived |
One process, five modules: Prober → Registry → Verifier → Findings Engine →
Reporter, plus an HTTP API on :8231 and a stdio MCP server. Full detail in
docs/architecture.md.
flowchart LR
    subgraph Audited["Audited pipeline (unmodified)"]
        Agent["Agent / App"] --> Gateway["Collector / Gateway"]
        Gateway --> SigNoz[("SigNoz\n(ClickHouse + Query API v5)")]
    end

    Prober["Prober\n(seq-numbered probes)"] -- "traces / logs / metrics" --> Agent
    Prober --> Registry["Registry\n(sent-probe ledger)"]
    Registry --> Verifier["Verifier\n(polls Query API v5)"]
    Verifier -- "independent query" --> SigNoz
    Verifier --> Findings["Findings Engine\n(gap runs, SLO, epochs)"]
    Findings --> Reporter["Reporter"]
    Reporter -- "out-of-band metrics/events" --> SigNoz
    Findings --> HTTPAPI["HTTP API :8231"]
    HTTPAPI --> UI["React dashboard"]
    HTTPAPI --> MCP["stdio MCP server"]
Two invariants hold across every module:
- Core invariant: SpanLedger may under-report loss but must never over-report it, enforced by the maturity delay, the finalization watermark, and the epoch model.
- Out-of-band law: SpanLedger's own metrics and findings travel directly to SigNoz, never through the pipeline being audited.
The backend keeps its own scratch state in a local SQLite journal (spanledger.db)
covering probes, events, and SLO buckets, so a restart doesn't silently lose incident
history.
SigNoz remains the system of record for presentation; SpanLedger never reads it back to
reconstruct its own state.


| Layer | Technology |
|---|---|
| Backend | Python 3.12, OpenTelemetry SDK, Click CLI, stdlib ThreadingHTTPServer |
| Local storage | SQLite (WAL mode): probe/event/bucket journal |
| Observability backend | SigNoz (ClickHouse + Postgres + Query API v5), deployed via Foundry |
| Frontend | Vite 6 + React 19 + TypeScript (strict), Tailwind CSS v3, TanStack Query v5, Recharts, react-router-dom v7 |
| Demo pipeline | OpenTelemetry Collector (agent + gateway), Toxiproxy (fault injection), Docker Compose |
| CI | GitHub Actions: ruff + pytest (backend), ESLint + Prettier + Vitest (frontend) |
spanledger/       Core auditor: config, probe, registry, verify, events (findings),
                   slo, signoz, store, report, httpapi, mcp, cli, check, assets
frontend/         React/TS dashboard (see frontend/README.md)
demo/             Compose stack (agent → otel-agent → toxiproxy → otel-gateway),
                   chaos scripts, and the demo traffic app
assets/           SigNoz dashboard + alert-rule JSON templates, rendered per config
                   via `spanledger assets render`
spikes/           Small standalone scripts validating risky assumptions pre-build
                   (see spikes/RESULTS.md)
docs/             Architecture, operations reference, frontend design docs, RFCs
test/             pytest suite (unit) + test/integration (Docker/SigNoz-backed)
casting.yaml      Foundry deployment descriptor for the SigNoz backend
spanledger/ module responsibilities
| Module | Responsibility |
|---|---|
probe.py |
Emits sequence-numbered spans/logs/metrics through the audited pipeline |
registry.py |
Tracks what was sent, per stream + epoch + signal |
verify.py |
Polls SigNoz's Query API v5 to reconcile sent vs. arrived |
events.py |
The V2 event spine: loss/recovery/budget/burn-rate events; findings.py re-exports the V1-compatible subset |
slo.py |
Pure SLI/error-budget/burn-rate math + the engine that buckets and evaluates it |
signoz.py |
The only SigNoz-coupled client: query + ingest |
store.py |
SQLite journal: probes, events, SLO buckets, deploy markers |
report.py |
Out-of-band metrics/events export back to SigNoz |
httpapi.py |
/status, /findings, and the /api/v2/* surface |
mcp.py |
The stdio MCP server exposing spanledger_check_telemetry_trust |
check.py |
Bounded, CI-gateable audit (spanledger check) |
assets.py |
Renders dashboard/alert templates with your config's SLO target |
- Docker (with Docker Compose)
foundryctl: deploys the SigNoz backend- Python ≥ 3.12
- Node.js ≥ 18 (only if you're running the frontend)
- Optional: a Groq API key, only for the demo's realistic LLM traffic profile
git clone https://github.com/furyfist/SpanLedger.git
cd SpanLedger

python -m venv .venv
.venv\Scripts\activate                       # Windows (source .venv/bin/activate on Unix)
pip install -r requirements.txtcp .env.example .env| Variable | Required | Purpose |
|---|---|---|
SIGNOZ_API_KEY |
Yes | Query API v5 access (SigNoz UI → Settings → Service Accounts) |
GROQ_API_KEY |
No | Only for --profile traffic: realistic LLM agent traffic in the demo |
curl -fsSL https://signoz.io/foundry.sh | bash
foundryctl cast -f casting.yaml
Wait for every container to report healthy (docker ps), typically 1–2 minutes. Then
open http://localhost:8080 and complete the signup wizard to create the SigNoz admin
account, which is required, not optional: the OTLP ingester only receives its real pipeline
config over OpAMP after an org/admin account exists. Skipping this step doesn't error;
it just makes every probe silently vanish, which looks identical to a real outage.
Mint an API key in Settings → Service Accounts and paste it into .env.
docker compose -f demo/compose.yaml up -d
export $(grep SIGNOZ_API_KEY .env)           # Windows cmd: set SIGNOZ_API_KEY=<paste key>
python -m spanledger run --config demo/spanledger.demo.yaml
Expected output within ~30 seconds:
spanledger started: epoch=... streams=2
verify gateway-a/traces: {'sent': 14, 'verified': 14, 'missing': 0, 'duplicate': 0, 'delivery_ratio': 1.0}
cd frontend
npm install
npm run dev
The dev server runs at http://localhost:5173 and proxies /api, /status,
/findings, and /healthz to the backend. No CORS setup needed. To explore the UI
without a live backend, run npm run dev -- -- --mode mock or visit
http://localhost:5173/?data=sim: a SIMULATED DATA badge appears whenever the UI
is not showing real backend data.
The normal flow, start to finish:
- Bring the stack up: Foundry-deployed SigNoz, the demo pipeline
(
docker compose -f demo/compose.yaml up -d), andspanledger run. Probes start flowing immediately. - Confirm a healthy baseline:
curl localhost:8231/statusor the dashboard's Overview page showsdelivery_ratio: 1.0across streams. - Inject silent loss:
sh demo/chaos/outage.sh 45stops the gateway for 45 seconds, past the agent's retry ceiling. Nothing else in the pipeline errors; it's a genuinely silent failure. - Watch a finding appear:
curl localhost:8231/findings(or the dashboard's Timeline/Incident pages) shows aclass: lossevent with delivery ratio dropped,gap_shape: contiguous, and atraces_filteryou can paste straight into SigNoz's Traces Explorer. - Ask "why are my traces missing?": an MCP-aware agent calls
spanledger_check_telemetry_trustfirst and gets backtrustworthy: falsewith a prose recommendation, instead of confidently diagnosing from an incomplete window. - Follow the evidence link: the incident's
signoz_urlopens SigNoz's Traces Explorer pre-filtered to the missing sequence range, confirming the gap directly. - Watch recovery: once the gateway comes back, a
recoveryevent closes the incident and the trust verdict flips back totrustworthy: true.
Every chaos scenario in demo/chaos/ is scripted so any number shown in
a demo is reproducible by re-running it: see demo/README.md and
demo/walkthrough.md for the full 3-minute recorded script.
SpanLedger reads a single YAML file (spanledger.yaml by default, or
--config <path>):
signoz:
  query_url: http://localhost:8080
  ingest_url: localhost:4317
  api_key_env: SIGNOZ_API_KEY
streams:
  - name: gateway-a
    endpoint: localhost:14317
probe:
  interval: 1s
verify:
  poll_interval: 15s
  maturity_delay: 30s
  lookback: 10m
alerting:
  min_delivery_ratio: 0.999
http:
  listen: :8231
slo:
  target: 0.999
  window_days: 28
storage:
  path: ./spanledger.db
Every top-level block is validated and fails fast on unknown keys. Streams can carry a
per-stream slo.target override and an optional signals: [traces, logs, metrics]
list. The full config reference, including the opt-in correlation and ledger
blocks, lives in docs/v2/OPERATIONS.md.
curl localhost:8231/status
curl localhost:8231/findings
curl "localhost:8231/api/v2/trust?from=<rfc3339>&to=<rfc3339>&stream=gateway-a"
The full /api/v2/* surface (status, per-stream snapshots, event queries, SLO
history, deploy markers) is in
docs/v2/OPERATIONS.md. Errors follow
RFC 7807 (application/problem+json).
MCP trust layer: python -m spanledger mcp --api http://localhost:8231 runs a
stdio MCP server exposing spanledger_check_telemetry_trust: a pure passthrough over
/api/v2/trust that lets an agent check whether a time window is trustworthy before
reasoning about gaps in it. See AGENTS.md and
docs/v2/OPERATIONS.md.
pip install -r requirements-dev.txt
pytest
ruff check .
Integration tests that need Docker + a live SigNoz are excluded from the default run:
see test/integration/README.md. Frontend commands are in
frontend/README.md (npm run test, npm run lint).
| Doc | What's in it |
|---|---|
| PROJECT_PLAN.md | Full original design |
| DECISIONS.md | Every deviation from the plan, with reasoning, dated |
| docs/architecture.md | The five-module pipeline and its invariants |
| docs/v2/OPERATIONS.md | Config keys, metrics, event classes, live drills |
| docs/v2/PENDING_WORK.md | Honest backlog: what's deferred and why |
| docs/ai-disclosure.md | AI-assistance disclosure |
| demo/README.md | Demo pipeline and chaos scenarios |
| demo/walkthrough.md | 3-minute recorded-demo script |
- Conservation ledger: per-hop accepted-vs-received reconciliation; sampling is built, the decomposition/flow API and dashboard view are pending.
- Logs-leg live verification: the logs verify path rides on the traces-leg spike result, not yet independently confirmed live.
- Confirm the SigNoz Traces Explorer deep-link format: the evidence URL returns 200, but whether it pre-populates the Query Builder isn't confirmed; copy-to-clipboard stays primary until it is.
- Light theme for the dashboard (dark-only today; tokens are already CSS variables).
- End-to-end (Playwright) test coverage for the frontend.
See the Documentation table above for the full, living backlog.
No license file is currently included in this repository. Until one is added, all rights are reserved by default. Check with the maintainer before reuse, or open an issue if you'd like a license added ahead of the public release.