create GC skew plots from DNA sequences in python
The easiest way to install gcskewer is though the python package index.
pip install gcskewer
This will fetch and install the latest version from: https://pypi.org/project/gcskewer/
You can also install gcskewer by cloning this repository.
gcskewer requires Bio,matplotlib and plotly. They should be installed automatically.
gcskewer can take DNA sequences in .fasta or .gbk format. You can specify with -f/--fasta or -g/--gbk. You can't do both at the same time - only define you sequence one! For example:
gcskewer -s -g example.gbk
or
gcskewer -s -f example.fasta
gcskewer has three output formats: .csv (a comma seperated table of the results), .svg (an editable vector format graph) and .html (an interactive graph of the results). You can specify which outputs you want with -c/--csv, -s/--svg and -p/--plot (for the .html). If you are unsure, you can just specify all three:
gcskewer -g example.gbk -c -s -p
gcskewer will automatically decide the window and step size for the analysis, however you can set these values yourself. For best results, I recommend using a step size that will result in around 1,000 steps. E.g. for a sequence of 50 kb use a step size of 50. Ensure that the window size is at least the same size as the step. You can set the window and step size with -ws/--window-size and -ss/--step-size, respectively. For example:
gcskewer -g example.gbk -ss 50 -ws 500
Example data and output is provided in the example_data directory in this repository. There are two subdirectories fasta and genbank to illustrate how gcskewer operates on different input types. Each directry contains the .csv, .svg and .html output and the command used to generate then data is stored as command.bash.
This script was origionally inspired by Nivina et al.'s paper: GRINS: Genetic elements that recode assembly-line polyketide synthases and accelerate their diversification. As such, I used the polyketide synthase tylactone as a test case. The sequence was obtained from MiBiG.
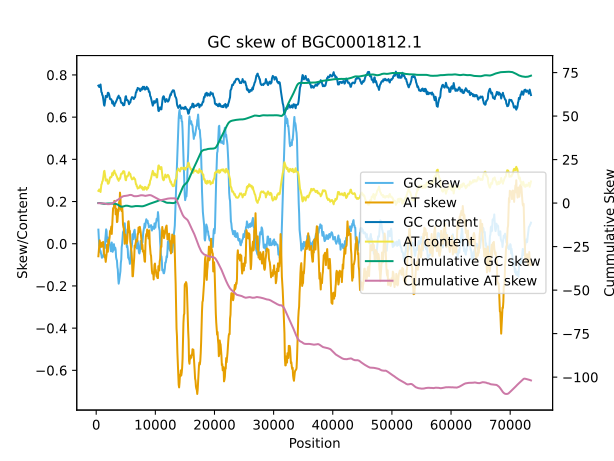
If you use gcskewer, please cite:
Gomez-Escribano, J. P., Dorai-Raj, S., Baker, D., Lacey, E., Wilkinson, B. and Booth, T. J. Evidence supporting the first secondary chromosome in Actinobacteria as a hallmark of the Embleya genus. Microb Gen 12 (5): 001704 (2025). DOI: https://doi.org/10.1099/mgen.0.001704
- 1.1.2
- added the option to write the output to a specific directory with
-dor--dir - organised arguments into argument groups
- added matplotlib to setup.py
- added the option to write the output to a specific directory with
- 1.1.1
- fixed error in midpoint calculation
- 1.1.0
- now also plots overall GC content
- frame plot data is now recorded as a class as opposed to depending pandas, this significantly improves runtime
- better naming of internal variables and functions
- removed erroneous placeholder text from parser and added example usage
- 1.0.0
- initial release