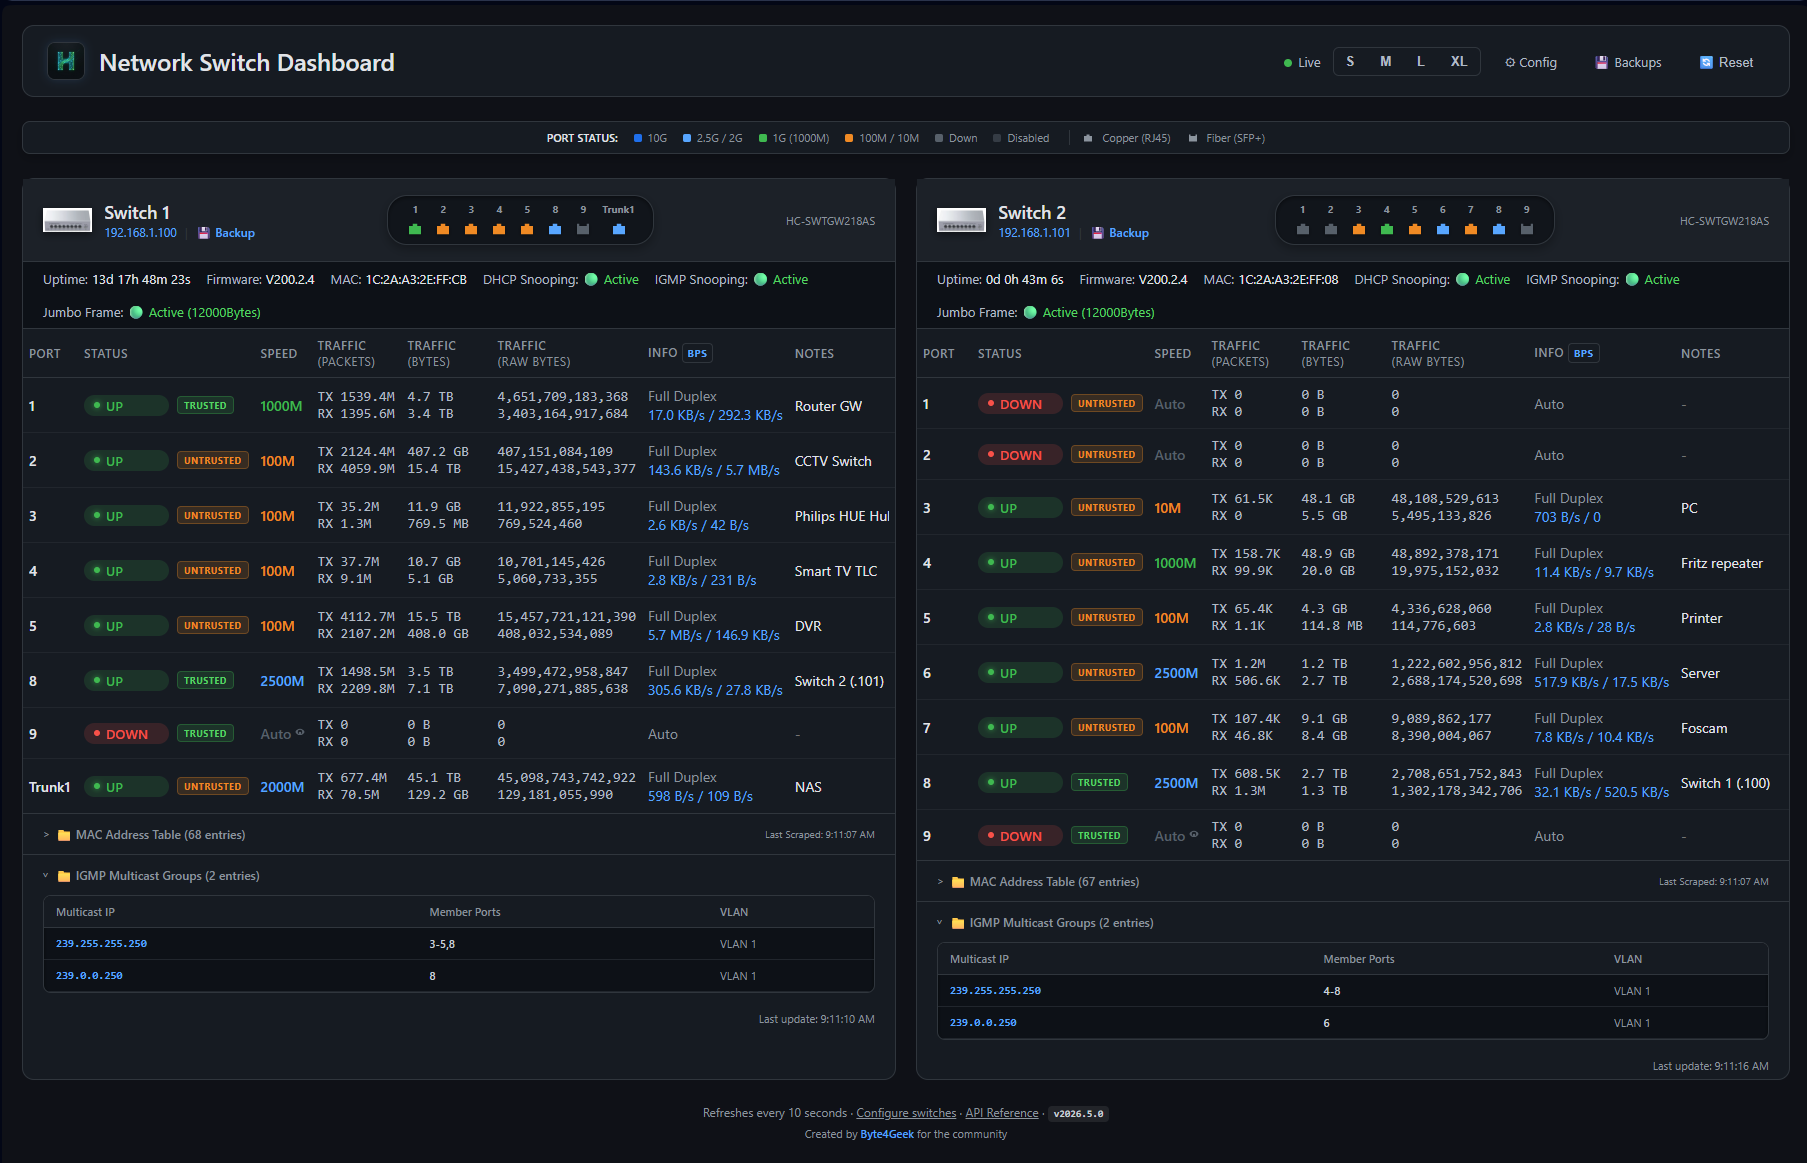
A premium, high-performance, real-time monitoring dashboard designed for Managed Chiese Switches similar to HORACO HC-SWTGW218AS 8-Port + 2-Port SFP+ (10G) managed switches. The dashboard queries the switch’s native HTTP CGI interface, meaning no SNMP setup or configuration is required.
Built with a gorgeous, high-tech glassmorphic dark-mode interface, it features automatic rolling bandwidth history, persistent byte-delta tracking, MAC address table searches, on-demand optical transceiver telemetry (DDMI), and a built-in interactive API explorer.
This dashboarb support these device:
- Stunning Dark Mode: Custom typography (Outfit/Inter/JetBrains Mono), harmonized color palettes, and frosted-glass components (
backdrop-filter: blur(12px)) that look amazing on operations consoles. - Micro-Animations: Dynamic state transitions, pulse loading indicators, and rotating refresh controls.
- Adaptive Grid Layout: Tailored viewports supporting smooth font scaling (S / M / L / XL) persisted directly to server settings.
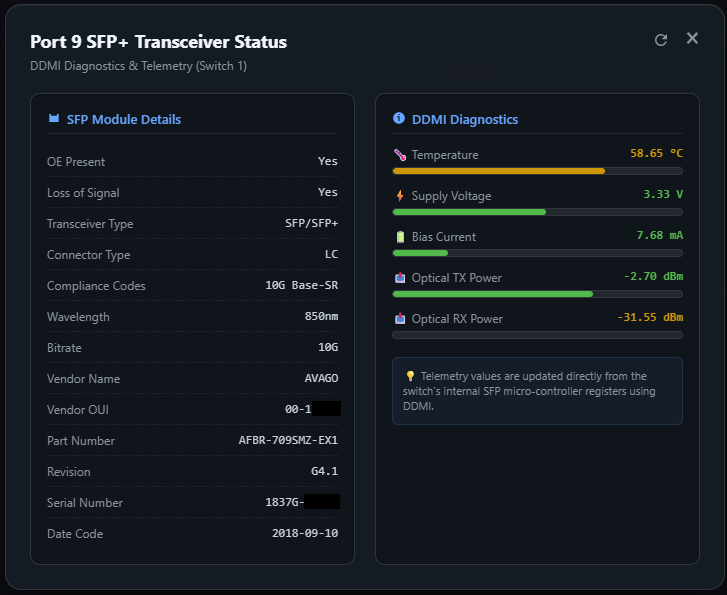
- Real-time Optical Sensors: Click the speed label of an SFP+ port (e.g. Port 9) to display physical module metadata (Vendor, Model, Serial, Compliances, Wavelength) and real-time DDMI diagnostics.
- Visual Telemetry Bars: Progress bars dynamically colored based on safe thresholds for:
- Temperature (°C)
- Supply Voltage (V)
- Bias Current (mA)
- TX/RX Optical Power (dBm)
- Dynamic Refresh Loop: Dedicated refresh button inside the modal to re-scrape physical hardware registers on-demand.
- Bs4 Malformed Parsing Fix: Custom pre-parsing sanitization engine handles malformed switch micro-controller HTML tables (like unclosed
<th>tags closed by</td>), ensuring perfect parsing.
- Multi-Scale Sparklines: Click any standard port speed to launch real-time bandwidth charts powered by Chart.js.
- Three-Tier Historical Ranges:
Live(High-resolution, real-time delta speed in bits per second)1-Hour(Rolling 1-hour average in Bytes per second)24-Hour(Rolling 24-hour average in 15-minute windows)
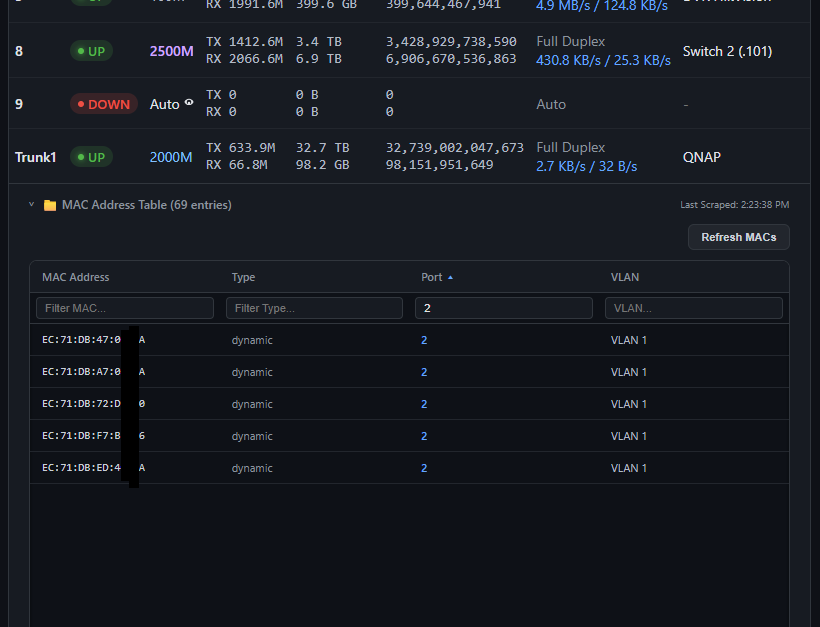
- Flexible Search & Filtering: Multi-column text filtering makes searching by VLAN, Port, MAC, or status trivial.
- Interactive Height Controls: Dynamically drag to resize table heights (saves user preference to
settings.jsonon disk). - Manual Re-indexing: On-demand POST request scraper forces active switches to dump fresh bridge routing entries.
- Multi-Switch Panel: Dynamically add, modify, or delete switches through a beautifully organized
/configroute. - Persistent Accumulation: Standard bytes counters are persistent across server reboots, complete with a delta tracking script to auto-detect and compensate for switch physical reboots without corrupting traffic metrics.
- Annotation Layer: Add custom, persistent labels/notes (e.g., "Uplink to NAS", "SmartTV") to any port.
- Built-in Docs: Hosted locally at
/api-docswith a beautiful, fast sidebar navigation. - Developer Resources: Contains interactive code cards, response payload previews, parameter grids, and copy-to-clipboard buttons for instant cURL examples.
- Global Configuration Tracking: Scrapes global enable state for DHCP Snooping and IGMP Snooping, rendering status badges directly on the dashboard.
- Port-Level Trust Badges: Real-time port trust classifications are fetched from
/port.cgito show customized untrusted and trusted labels. - IGMP Multicast Tables: Fully parsed multicast group database extracted from
/igmp.cgi?page=dumpdisplayed in an expandable glassmorphic table.
- Frame Size Scraper: Inspects
/fwd.cgi?page=jumboframeto retrieve Jumbo Frame configuration status and parse the exact selected frame size (e.g.9216Bytes).
- Config Backups: Safely triggers configuration archive downloads via
/config_back.cgi?cmd=conf_backup, storing them directly on the server's disk space. - Interactive Manager: Beautiful
/backupsinterface listing saved configs with quick downloads and single-click deletions protected by glassmorphic modal dialogues.
- Remote Power Cycle: Triggers a remote switch reboot via
/reboot.cgisecurely. - Safety Confirmation: Uses an immersive custom warning card modal using frosted glass backdrop effects, with real-time feedback loops during reboot execution.
graph TD
    A[User Browser] -- HTML5 / JS / Chart.js --> B[Flask Server: Port 8080]
    B -- Config / API Route --> C[Local Cache: config.json / counters.json]
    B -- Background Poller / Thread --> D[scraper.py]
    D -- HTTP POST Login / CGI Scrape --> E[Managed Switch: 192.168.1.100]
    E -- /info.cgi, /port.cgi, /transceiver.cgi --> D
    B -- Interactive Explorer --> F[API Reference: /api-docs]
- Backend: Flask (Python 3.9+), single-worker polling thread to prevent session thrashing.
- Frontend: Vanilla ES6 JS, Custom CSS (Aesthetic glassmorphism), Chart.js (multi-tier canvas).
- Scraper: Custom HTTP CookieJar scraper communicating with switch
/login.cgi,/info.cgi,/port.cgi?page=stats, and/transceiver.cgi.
- Python 3.9+
- Operating System: Linux with
systemd(Debian, Ubuntu, CentOS, Arch) or standalone Windows/macOS. - Network Access: Port 80 access to target managed switches (e.g. HORACO
HC-SWTGW218ASor OEM equivalents).
Our automated script handles the entire installation seamlessly, creating a dedicated Python virtual environment to avoid interfering with system packages.
# Clone the repository
git clone https://github.com/yourusername/switch-dashboard.git
cd switch-dashboard

# Run the installer as root
sudo bash install.sh
The script will:
- Copy all project files to
/opt/switch-dashboard/. - Check for system-level dependencies (
python3-pip,python3-venv). - Set up a secure virtual environment inside
/opt/switch-dashboard/venv. - Install all requirements (
Flask,BeautifulSoup4). - Generate and register a
switch-dashboard.servicewithsystemd. - Start and enable the service on boot.
Once completed, the dashboard is live at:
- Dashboard:
http://<your-ip>:8080 - API Documentation:
http://<your-ip>:8080/api-docs
You can deploy the Switch Dashboard as a lightweight Docker container. All persistent configurations, history files, and switch backups are managed inside a single volume or host directory mapping.
The dashboard keeps its state in several files and a backup folder:
- Configurations & Settings:
config.json,settings.json,notes.json - Bandwidth & Counters:
counters.json,history_hourly.json,history_daily.json - Switch Backups:
/backup/subdirectory
All of the above items are unified under the path specified by the DASHBOARD_DATA_DIR environment variable (defaults to /data in the container). You only need to mount/persist this single folder!
A pre-configured docker-compose.yml is provided in the repository.
-
Clone the repository:
git clone https://github.com/yourusername/switch-dashboard.git cd switch-dashboard -
Configure your switches: You can either edit
config.jsonbefore running the container, or simply let the container initialize the defaultconfig.jsoninside the mounted volume directory (./data), and then edit it there or via the dashboard's/configpage. -
Start the container:
docker compose up -d
-
Access the dashboard: Go to
http://<your-ip>:8080in your web browser. All your configs, notes, backups, and charts history will be persisted in the local./datafolder on the host.
To run the container manually with the Docker CLI:
-
Build the image:
docker build -t switch-dashboard . -
Run the container with a volume:
docker run -d \
  --name switch-dashboard \
  --restart unless-stopped \
  -p 8080:8080 \
  -v /absolute/path/to/your/data:/data \
  -e DASHBOARD_DATA_DIR=/data \
  switch-dashboard
Replace
/absolute/path/to/your/datawith the actual directory path on your host where you want to store your persistent data.
The dashboard supports template-driven scraping. This enables users to add support for any managed switch model simply by writing a declarative YAML blueprint and placing it in the ./device-templates/ directory.
A switch template is named <model_name>.yaml (where <model_name> matches the model field configured for the switch in /config or config.json).
Here is a complete reference of the YAML blueprint schema:
model: "HC-SWTGW218AS"          # The exact switch model name
manufacturer: "Horaco"           # Brand/Manufacturer name

# 1. Device Global Information (from /info.cgi key-value tables)
device_info:
  url: "/info.cgi"
  method: "key_value_grid"
  mappings:
    uptime: "Sys Uptime"
    mac: "MAC Address"
    ip: "IP Address"
    firmware: "Firmware Version"
    model: "Device Model"

# 2. Port Link Settings & Statuses
ports:
  url: "/info.cgi"
  source: "info_table"           # "info_table" (Horaco style) or "port_table" (KeepLink style)
  columns:
    port: 0
    link: 1
    duplex: 2
    speed: 3
    flow_control: 4

# 3. Port Transmission/Reception counters
statistics:
  url: "/port.cgi?page=stats"
  method: "header_aware"
  terms:
    tx_packets: ["txgoodpkt", "txpackets", "tx packet", "txok"]
    rx_packets: ["rxgoodpkt", "rxpackets", "rx packet", "rxok"]
    tx_bytes: ["txbytes", "tx_bytes", "txgoodbytes"]
    rx_bytes: ["rxbytes", "rx_bytes", "rxgoodbytes"]

# 4. DHCP Snooping Status & Trusted Ports
dhcp_snooping:
  url: "/dhcp_snooping.cgi?page=dump"
  enable_input_name: "enable_dhcpsnp"
  ports_form_action: "page=static"
  trust_checkbox_class: "chkp"

# 5. IGMP Snooping Multicast Groups Table
igmp:
  url: "/igmp.cgi?page=dump"
  enable_input_name: "enable_igmp"
  table_header_keywords: ["IP Address", "Port", "VLAN ID"]

# 6. Jumbo Frame Parameter
jumbo_frame:
  url: "/fwd.cgi?page=jumboframe"
  enable_input_name: "enable_jumbo"
  select_name: "jumboframe"

# 7. MAC Address Forwarding Table (with paging)
mac_table:
  url: "/mac.cgi?page=fwd_tbl"
  page_parameter: "pageidx"
  perpage_parameter: "perpage"
  perpage_value: "3"
  cmd_parameter: "cmd"
  cmd_value: "goto"

# 8. CGI Configuration Backup download
backup:
  url: "/config_back.cgi?cmd=conf_backup"
  referer_path: "/config_back.cgi"
  method: "GET"

# 9. Switch Remote Reboot action
reboot:
  url: "/reboot.cgi"
  referer_path: "/reboot.cgi"
  method: "POST"
  post_data:
cmd: "reboot"To add a dedicated device photo or graphic to the switch card:
- Place a
.png,.jpg, or.jpegfile in the./device-templates/directory. - Name the file exactly after the switch model (e.g.
HC-SWTGW218AS.png). - If no custom image is found, the system will seamlessly fall back to a beautifully stylized 8-port switch icon located at
/static/switch_icon.png.
If you prefer to configure the dashboard manually or want to run it on non-systemd machines (Windows / macOS):
python3 -m venv venv
source venv/bin/activate
pip install -r requirements.txtCreate or edit /opt/switch-dashboard/config.json:
{
  "title": "Network Command Center",
  "refresh_interval": 10,
  "mac_refresh_multiplier": 5,
  "switches": [
    {
      "name": "HORACO Core",
      "ip": "192.168.1.100",
      "username": "admin",
      "password": "admin",
      "model": "HC-SWTGW218AS",
      "port_count": 9
    }
  ]
}python3 app.pyThe dashboard includes a set of REST endpoints. For complete details, response payloads, and copyable cURL examples, navigate to the /api-docs route.
| Method | Endpoint | Description |
|---|---|---|
GET |
/api/switches |
Returns live status of all switches and ports, including custom notes. |
GET |
/api/switches/<ip>/transceiver |
Returns parsed SFP module diagnostics and DDMI telemetry. |
POST |
/api/switches/<ip>/refresh_mac |
Forces an immediate scrape and returns the active MAC forwarding table. |
GET |
/api/speeds |
Returns real-time delta speed states (Bytes/s, bps) for active interfaces. |
GET |
/api/history |
Returns high-res historical statistics for Chart.js (live, 1h, 24h). |
POST |
/api/notes |
Attaches a persistent label/description to a port (saves to notes.json). |
GET |
/api/settings |
Retrieves global UI preferences (e.g., base font scale). |
POST |
/api/settings |
Updates global UI settings on the disk. |
POST |
/api/reset |
Purges cumulative logs and bandwidth cache, resetting delta Baselines. |
POST |
/api/switches/<ip>/backup |
Triggers a configuration backup and saves the binary archive to the server's disk. |
POST |
/api/switches/<ip>/reboot |
Safely sends a reboot trigger to the physical switch hardware. |
GET |
/api/backups |
Lists all configuration backups stored on the server. |
GET |
/api/backups/<filename>/download |
Downloads a specific saved switch configuration file. |
DELETE |
/api/backups/<filename> |
Deletes a specific switch configuration file from the server. |
GET |
/backups |
Returns the HTML template for the backups manager dashboard. |
GET/POST |
/api/vendors |
Retrieves or saves custom MAC vendor mappings (mac_vendors.txt). |
POST |
/api/vendors/update_oui |
Manually downloads and caches the official IEEE OUI and OUI-36 databases. |
/opt/switch-dashboard/
├── app.py              # Flask core service, poller thread, and REST API routes
├── scraper.py          # Switch scraping engine, custom login cookie session, and tags cleaner
├── config.json         # User-defined switches, polling intervals, and general configuration
├── counters.json       # Persistent cumulative traffic database
├── notes.json          # Persistent custom port descriptions
├── settings.json       # Persisted user UI configurations (e.g. font sizes, table dimensions)
├── mac_vendors.txt     # Local custom OUI vendor names/overrides file
├── oui.txt             # Downloaded official IEEE OUI-24 database
├── oui36.txt           # Downloaded official IEEE OUI-36 database
├── install.sh          # Self-healing, multi-distro Linux automated systemd installer
├── requirements.txt    # Python package dependencies
├── templates/
│   ├── index.html      # Main high-tech glassmorphic dashboard
│   ├── config.html     # Switch configurator interface
│   └── api_docs.html   # Premium built-in developer documentation manual
└── static/
    ├── style.css       # Premium core CSS tokens, custom dark scrollbars, and layouts
    ├── app.js          # Core front-end logic, rendering engine, Chart.js mapping
    └── logo.png        # Horaco brand assets
This project is licensed under the MIT License. Feel free to modify, distribute, or incorporate it into your network setup.
- 🌐 Dynamic MAC Address Vendor Resolution:
- Automatically matches MAC addresses to manufacturers using the official IEEE OUI registry (
oui.txtandoui36.txt). - Added support for a custom MAC vendors file (
mac_vendors.txt) mapping local MAC prefixes to custom device names (e.g.,AA:BB:CC Custom Local Device). - Included a Custom MAC Vendors Editor directly on the Settings configuration page.
- Implemented an IEEE OUI Database Update utility card in
/configto manually download the latest registration lists. - Added query rate warnings detailing IEEE's query limits (maximum 1 download request per day to prevent IP address bans).
- Automatically matches MAC addresses to manufacturers using the official IEEE OUI registry (
- 🎛️ Interactive Table Resizing & Reordering:
- Implemented interactive drag-and-drop reordering for all dashboard switch table columns.
- Added support for interactive column width resizing by dragging column margins.
- Persists custom widths and column ordering directly inside local browser cookies.
- Implemented cell auto-wrapping when columns are resized narrow, preventing text overflow.
- 🎨 General Layout Config & Column Visibility:
- Added a General Settings layout option dropdown in
/configto choose the maximum number of switches shown side-by-side (Auto, 1, 2, 3, or 4). - Added a column visibility checklist in the Settings page to enable or disable individual dashboard columns dynamically.
- Added a General Settings layout option dropdown in
- 📖 API Docs Update:
- Documented
POST /api/vendors/update_ouiandGET/POST /api/vendorsendpoints in the local/api-docspath.
- Documented
- 🔌 RTLPlayground Custom Switch Firmware Support:
- Generated and packaged a dedicated declarative switch scraper template
RTLPlayground.yamlto fully support Realtek RTL8372/RTL8373 switches running the open-source RTLPlayground alternative firmware bylogicog. - Added support for the default RTLPlayground network segments (e.g.
192.168.10.247), uIP embedded web server structures, and specialized/ports,/stats,/vlan,/config, and/rebootAPI pathways. - Automatically parses port status states, EEE configurations, packet transmission statistics, and handles safe device reboots.
- Generated and packaged a dedicated declarative switch scraper template
- 📋 Dynamic YAML-Driven Scraper Blueprints:
- Implemented dynamic, extensible scraping logic driven by declarative YAML templates under
./device-templates/. - Seamlessly appended CGI settings for administrative actions: Configuration Backup downloads (
backup) and Switch hardware reboots (reboot) inside reference blueprints. - Custom switch models now support 100% template-driven telemetry retrieval (Device Info, Port Link speed, Packets/Bytes statistics, DHCP trust, IGMP multicast, and MAC tables).
- Implemented dynamic, extensible scraping logic driven by declarative YAML templates under
- 🎨 Custom Switch Graphic Icons:
- Automatically loads per-model graphics (e.g.
./device-templates/HC-SWTGW218AS.pngor.jpg) in the dashboard switch card, falling back to a newly designed premium stylized 8-port switch icon at/static/switch_icon.pngif missing.
- Automatically loads per-model graphics (e.g.
- 📂 Bounded Rotational Logging Directory:
- Relocated and consolidated logging output to the dedicated
./logs/directory (logs/dashboard.log), securely ignoring all log traces inside.gitignore.
- Relocated and consolidated logging output to the dedicated
- 🩹 Dynamic Switch Model Fallback:
- Fixed a bug where switches that do not explicitly report their model inside
/info.cgi(such asLIANGUO LG-SG5T1) incorrectly fell back to a hardcoded"HC-SWTGW218AS"model name in the UI. The scraper now dynamically falls back to the exact model name specified inconfig.json. - Changed the default fallback in
scraper.py(when the"model"attribute is omitted fromconfig.jsonentirely) to a clean, generic"Generic Model"string to avoid any brand confusion.
- Fixed a bug where switches that do not explicitly report their model inside
- 🐳 Docker & Docker Compose Support:
- Implemented lightweight Docker containerization using a standard
Dockerfilebuilt onpython:3.11-slimand a unifieddocker-compose.yml.
- Implemented lightweight Docker containerization using a standard
- 💾 Unified Persistent Storage Mapping:
- Conserved configurations, notes, speed history, and backups inside a single
/datafolder inside the container mapped to a custom environment variableDASHBOARD_DATA_DIR.
- Conserved configurations, notes, speed history, and backups inside a single
- 🛡️ Auto-Initialization Safeguard:
- Automatically initializes volume directories with default configuration files upon startup if mapped to empty host folders to avoid container crash loops.
- 📦 Absolute Resource Pathing:
- Configured Flask absolute template and static directories dynamically to resolve relative directory conflicts inside Docker environments.
- 🎨 Administrative Port Contrast & Legend Integration:
- Outlined administratively disabled ports in the graphical representation using a unique, premium dark-grey (
#353c45) to distinguish them from standard offline ports (#57606a). - Integrated the new Disabled status label and color badge directly into the central
PORT STATUSlegend.
- Outlined administratively disabled ports in the graphical representation using a unique, premium dark-grey (
- 🔒 Administrative Port Status Scraping:
- Upgraded scraping engine to fetch
/port.cgiand parse active configuration states, accurately reportingDISABLEstatus instead of misleading physical link states.
- Upgraded scraping engine to fetch
- 🔄 Safe Device Reboot Modal:
- Implemented secure switch reboots via
/reboot.cgiwith an immersive glassmorphic warning modal to protect users from accidental network disruption.
- Implemented secure switch reboots via
- 💾 Configuration Backup Manager:
- Added on-demand server-side configuration backups (
.binfiles) with an interactive dashboard to download, view, and safely delete configurations.
- Added on-demand server-side configuration backups (
- 🟢 Snooping & Multicast Telemetry Integration:
- Integrated global and port-level status for DHCP Snooping, IGMP Snooping (with collapsible multicast table), and Jumbo Frame size properties.
- 🎨 Visual Color Harmonization:
- Aligned table port speed texts (
colonna speed) with matching port status indicators in the graphics bar.
- Aligned table port speed texts (
- 📋 Interactive API Reference Expansion:
- Documented reboot and backups endpoints in the interactive local
/api-docsinterface.
- Documented reboot and backups endpoints in the interactive local
Buy me a coffee