JavaFX
After it's first iteration, USOC has been ported from Swing to JavaFX. After the summer of 2018, it has suffered some modifications, particularly in the visualization module (GUI).
The MainWindow can be divided into 3 sections (all inside a SplitPane). Each of these sections (which we will call panels from now on) are implemented on individual class files, to allow more modularity.
The picture below shows the State Panel:
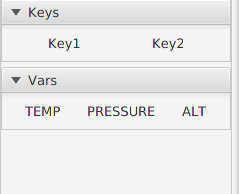
It holds groups of states (called Segments). Each state can represent a data point from a given sensor. A ContextMenu (the menu that appears when an item is right clicked) allows for easy modification of this panel(Add/Remove segments, assign data to individual states, etc).
The pictures below shows the USOC Panel: (both tabs side by side)
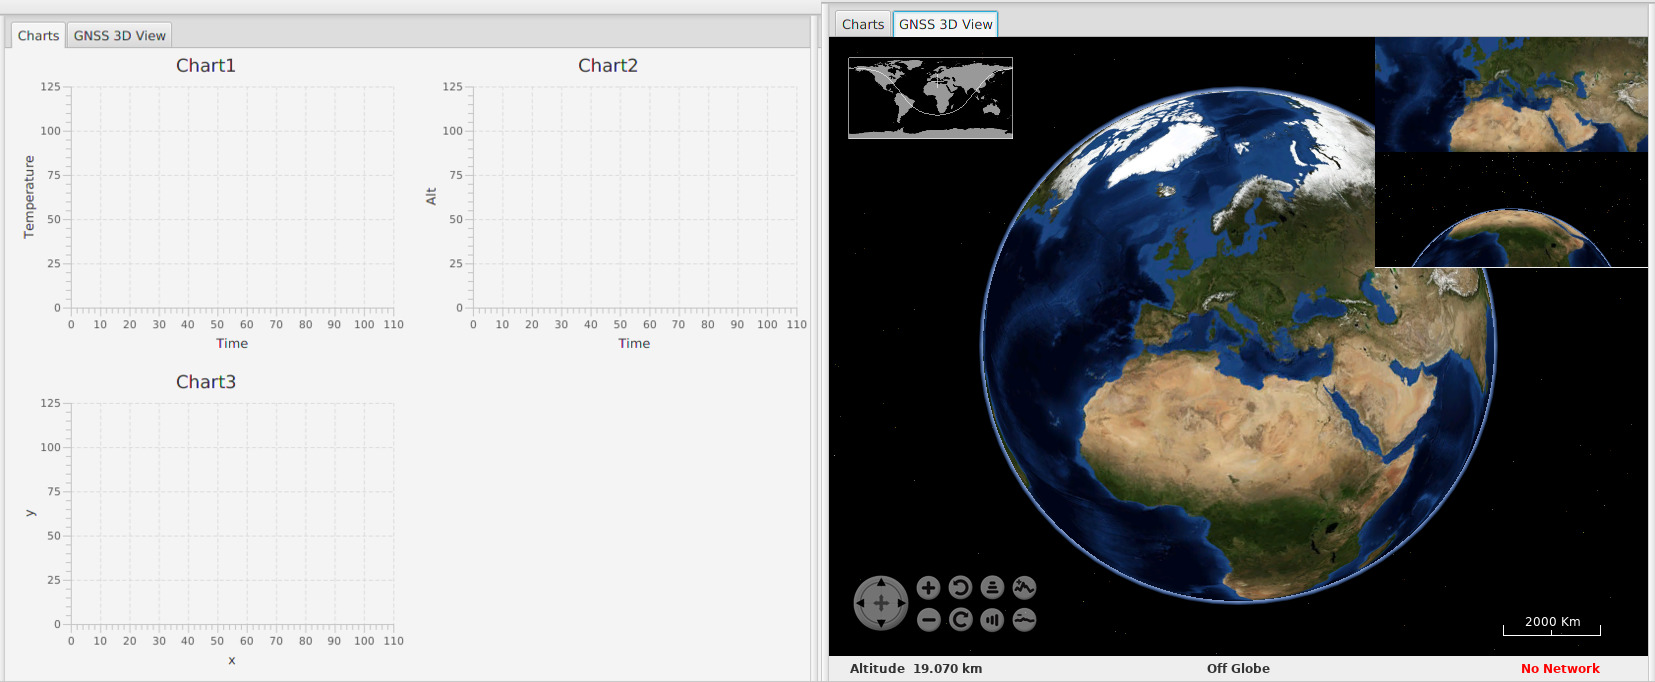
This is the central item of the MainWindow. It has two components, inside of a TabPane:
- The Chart Grid
- The GNSS View
Similarly to the State Panel, the Chart Grid also has a set of features accessible through a ContextMenu.
The charts in the Java Swing GUI are implemented using the JFreeChart library. This library allows to draw line charts (which are good for displaying sensor data) relatively easy.
The charts are connected to the MainController using the Observer Pattern described in the Internal Communication section and get updated every time new data is parsed.
An example of this implementation is provided below:
public LineChart(String chartname, String x, String y, String seriesname, TreeMap<Long, Object> data, DataType dt) {
    dataset = new XYSeriesCollection();
    addSeries(seriesname, data, dt);
    chart = createChart(chartname, x, y, dataset);
    final ChartPanel chartPanel = new ChartPanel(chart);
    this.add(chartPanel);
}The picture below shows the IridiumLogPanel.
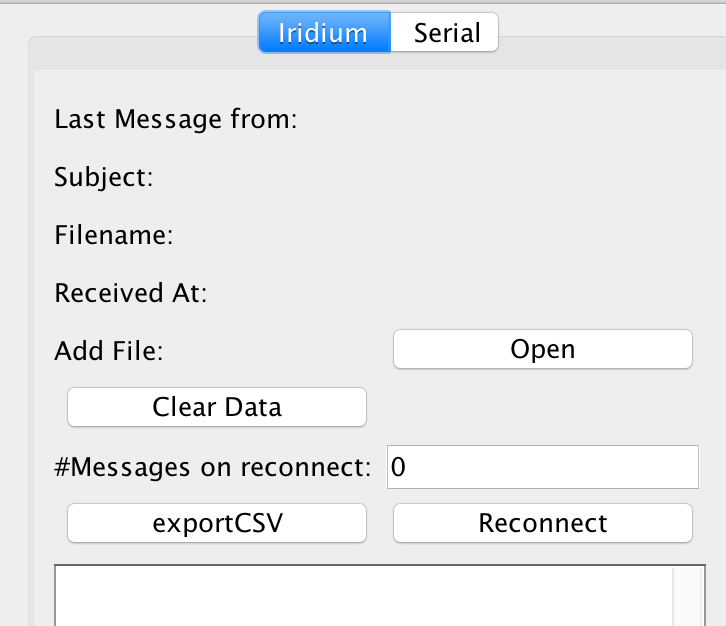
Every time a MailEvent is detected, the text area gets updated with the newest log information. The buttons and labels above have the following purposes:
This shows the subject of the latest e-mail.
This shows the sender of the latest e-mail.
This shows the file name of the latest attachment.
This shows the time stamp at which the e-mail was received by the mail server.
This shows a file chooser dialog where the user can choose to open files to display in the ground station.
This allows to clear the data currently displayed by the ground station.
This allows to set the number of messages that will be downloaded once the reconnect button is pressed.
This allows to export the displayed data to a csv file.
This allows to reconnect to the mail server in case, an error occured or the connection was lost.
The picture below shows the SerialLogPanel
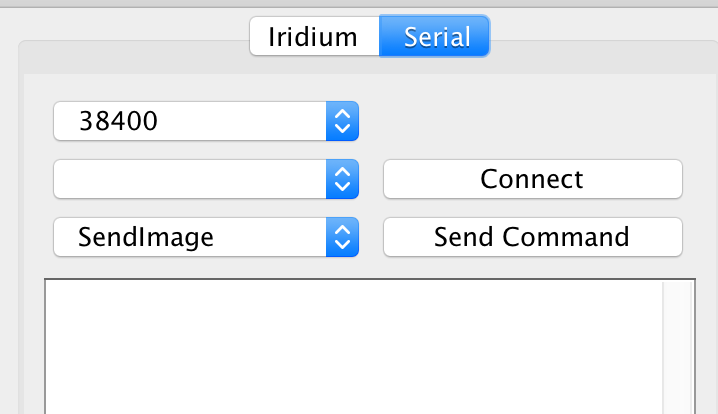
Every time a SerialEvent is detected, the text area gets updated with the newest log information. The buttons and labels above have the following purposes:
This allows you to specify at what baudrate you want to connect to the serial port.
This allows you to set the port you want to connect to. The port gets updated regularly every 500ms and new ports will show in the JComboBox
This allows you to specify the command you want to send via the serial interface.
This allows you to send the specified command to the connected serial port
This will connect the ground station to the selected serial port at the selected baud rate.