Python package for Google's Groundsource flash flood dataset.
Google used Gemini to extract 2.6 million flash flood events from news articles across 150+ countries (2000-2026). The raw data is a 667MB Parquet file with undocumented WKB geometries and no location labels. This package decodes the geometries, tags every event with country and continent, and provides a clean search and analysis API.
from groundsource import FloodDB

db = FloodDB()  # auto-downloads + enriches on first run
floods = db.search(country="India", year_range=(2020, 2025))pip install groundsourceRequirements: Python 3.9+, pandas, pyarrow, geopandas, shapely, matplotlib
On first run, the package downloads the dataset from Zenodo (~667MB), decodes 2.6M WKB polygons, and performs a spatial join against Natural Earth boundaries. This takes 2-3 minutes and is cached locally for instant subsequent loads.
from groundsource import FloodDB
db = FloodDB()

# By country (supports common aliases: "USA", "UK", "UAE", etc.)
db.search(country="India")
db.search(country="USA", year_range=(2020, 2025))

# By city (98 major cities built-in, default 100km radius)
db.search(city="Houston", radius_km=50)

# By continent or bounding box
db.search(continent="Asia")
db.search(bbox=[0, 95, 25, 120]) # [min_lat, min_lon, max_lat, max_lon]db.trend(country="India") # yearly event counts
db.growth(country="India") # growth rate between two periods
db.compare(["USA", "UK", "India", "Indonesia"]) # side-by-side comparison
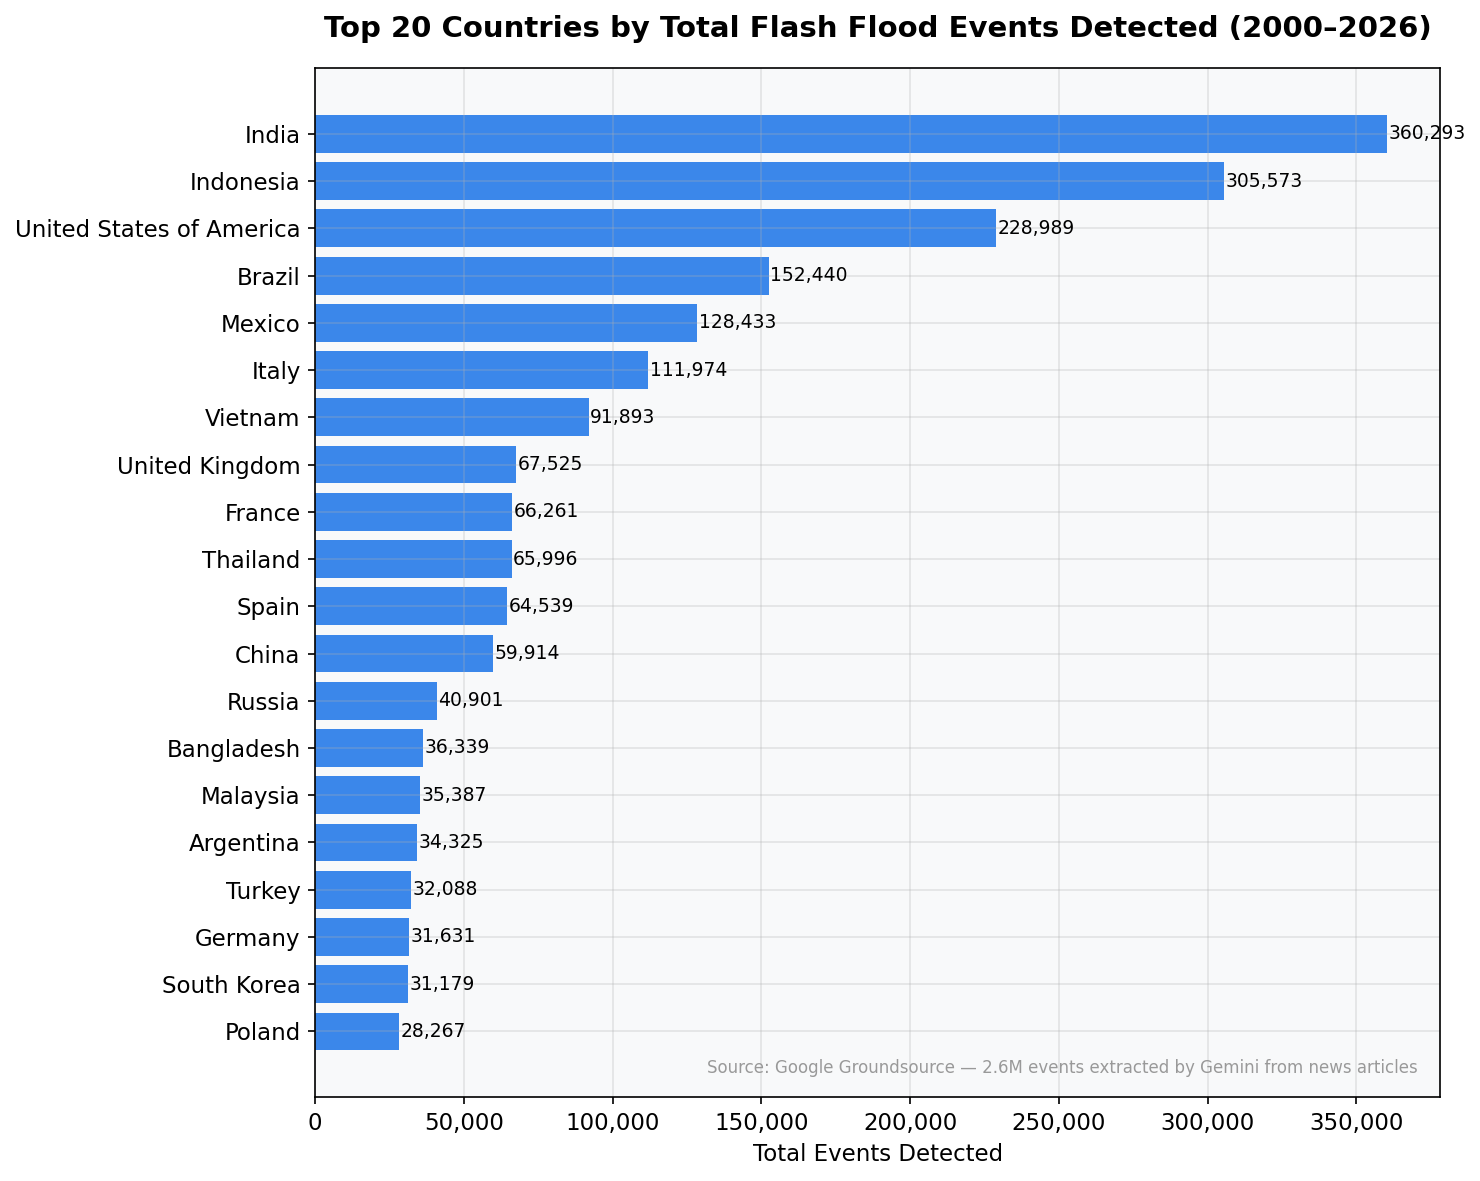
db.top_countries(20) # ranked by total events
db.country_growth_ranking(20) # ranked by growth acceleration
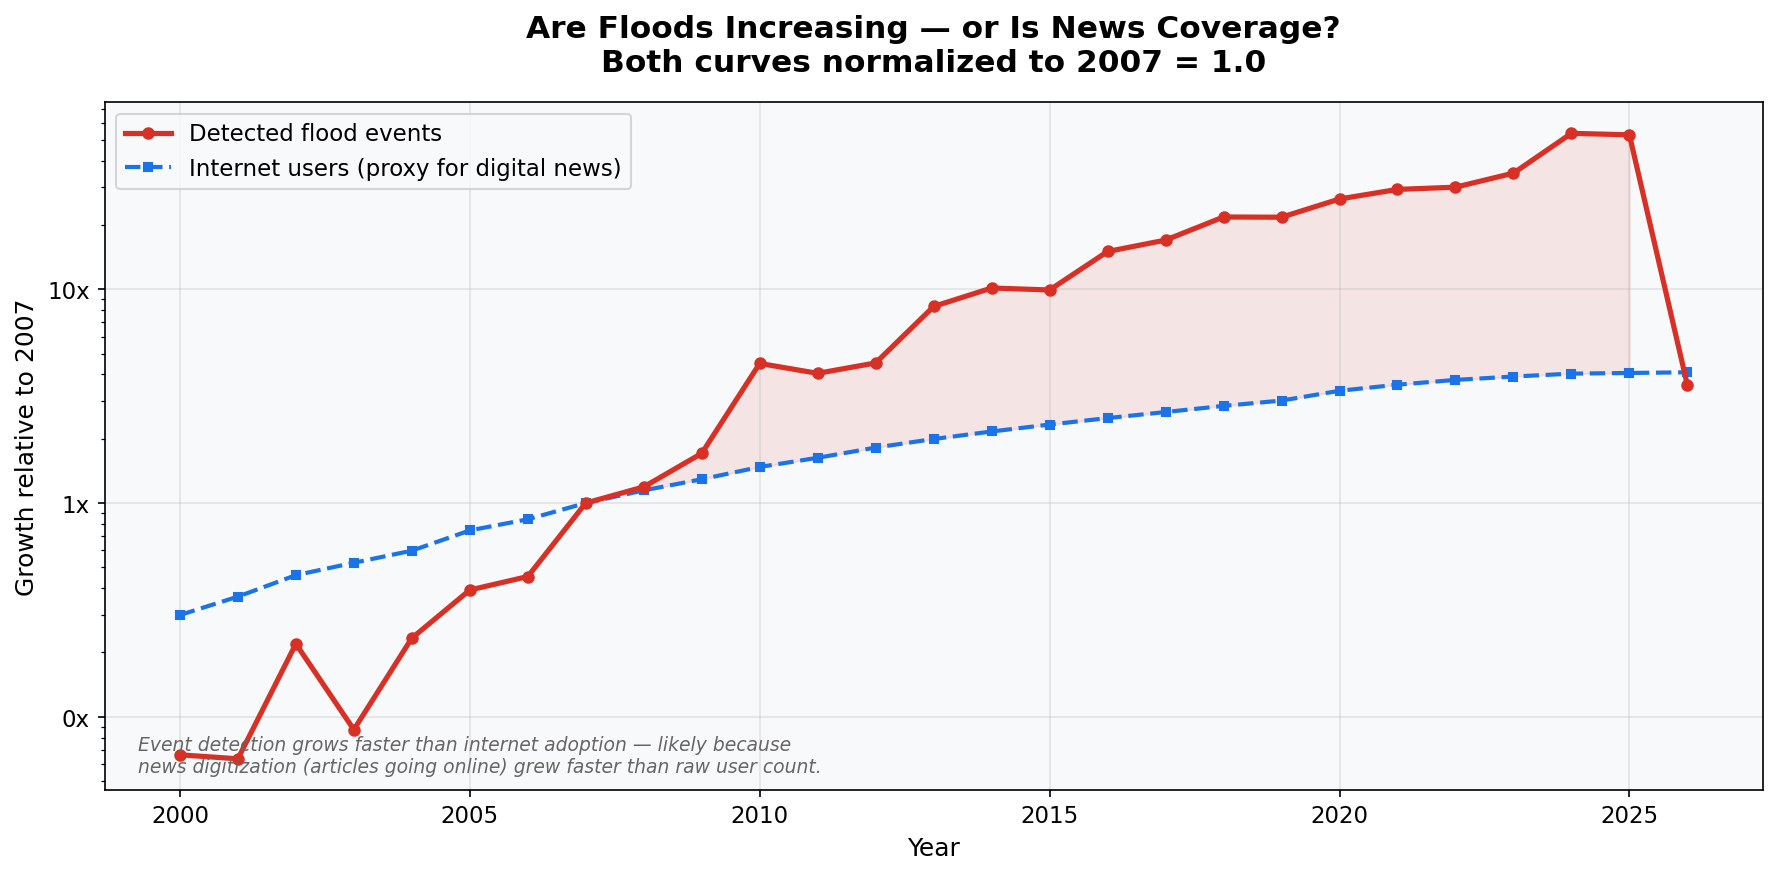
db.bias_check() # global yearly counts for bias analysisdb.plot_hockey_stick(save_path="hockey_stick.png")
db.plot_bias(save_path="bias.png")
db.plot_top_countries(save_path="top_countries.png")
db.plot_country_growth(save_path="growth.png")df = db.to_dataframe()
# Columns: uuid, area_km2, start_date, end_date, centroid_lon, centroid_lat,
# country, iso_a3, continent, yearThe raw Parquet from Zenodo has 5 columns with no documentation:
| Raw Column | Type | Issue |
|---|---|---|
uuid |
string | ID only |
area_km2 |
float | Usable as-is |
geometry |
WKB binary | Requires shapely to decode |
start_date |
string | Not parsed as datetime |
end_date |
string | Not parsed as datetime |
This package enriches each event with:
| Added Column | Source |
|---|---|
centroid_lon, centroid_lat |
Decoded from WKB polygons |
country, iso_a3 |
Spatial join against Natural Earth |
continent |
Natural Earth |
year |
Extracted from start_date |
The dataset shows 498 events in 2000 and 402,012 in 2024. This does not mean floods increased 807x. The data is extracted from news articles, and digital news coverage grew dramatically over this period. Any trend analysis should account for this reporting bias. Use db.bias_check() and db.plot_bias() to visualize this.
- Source: Google Groundsource
- Download: Zenodo (CC BY 4.0)
- Records: 2,646,302 events across 175 countries, 2000-2026
- Method: Gemini parsed ~5M news articles
- Accuracy: 60% location+timing, 82% practically useful (per Google)
MIT. The underlying dataset is licensed CC BY 4.0 by Google.
Google Research. Groundsource: Turning News Reports into Data with Gemini. Zenodo, 2026. DOI: 10.5281/zenodo.18647054