
Learning from spectroscopy: monitoring of microalgae cultures
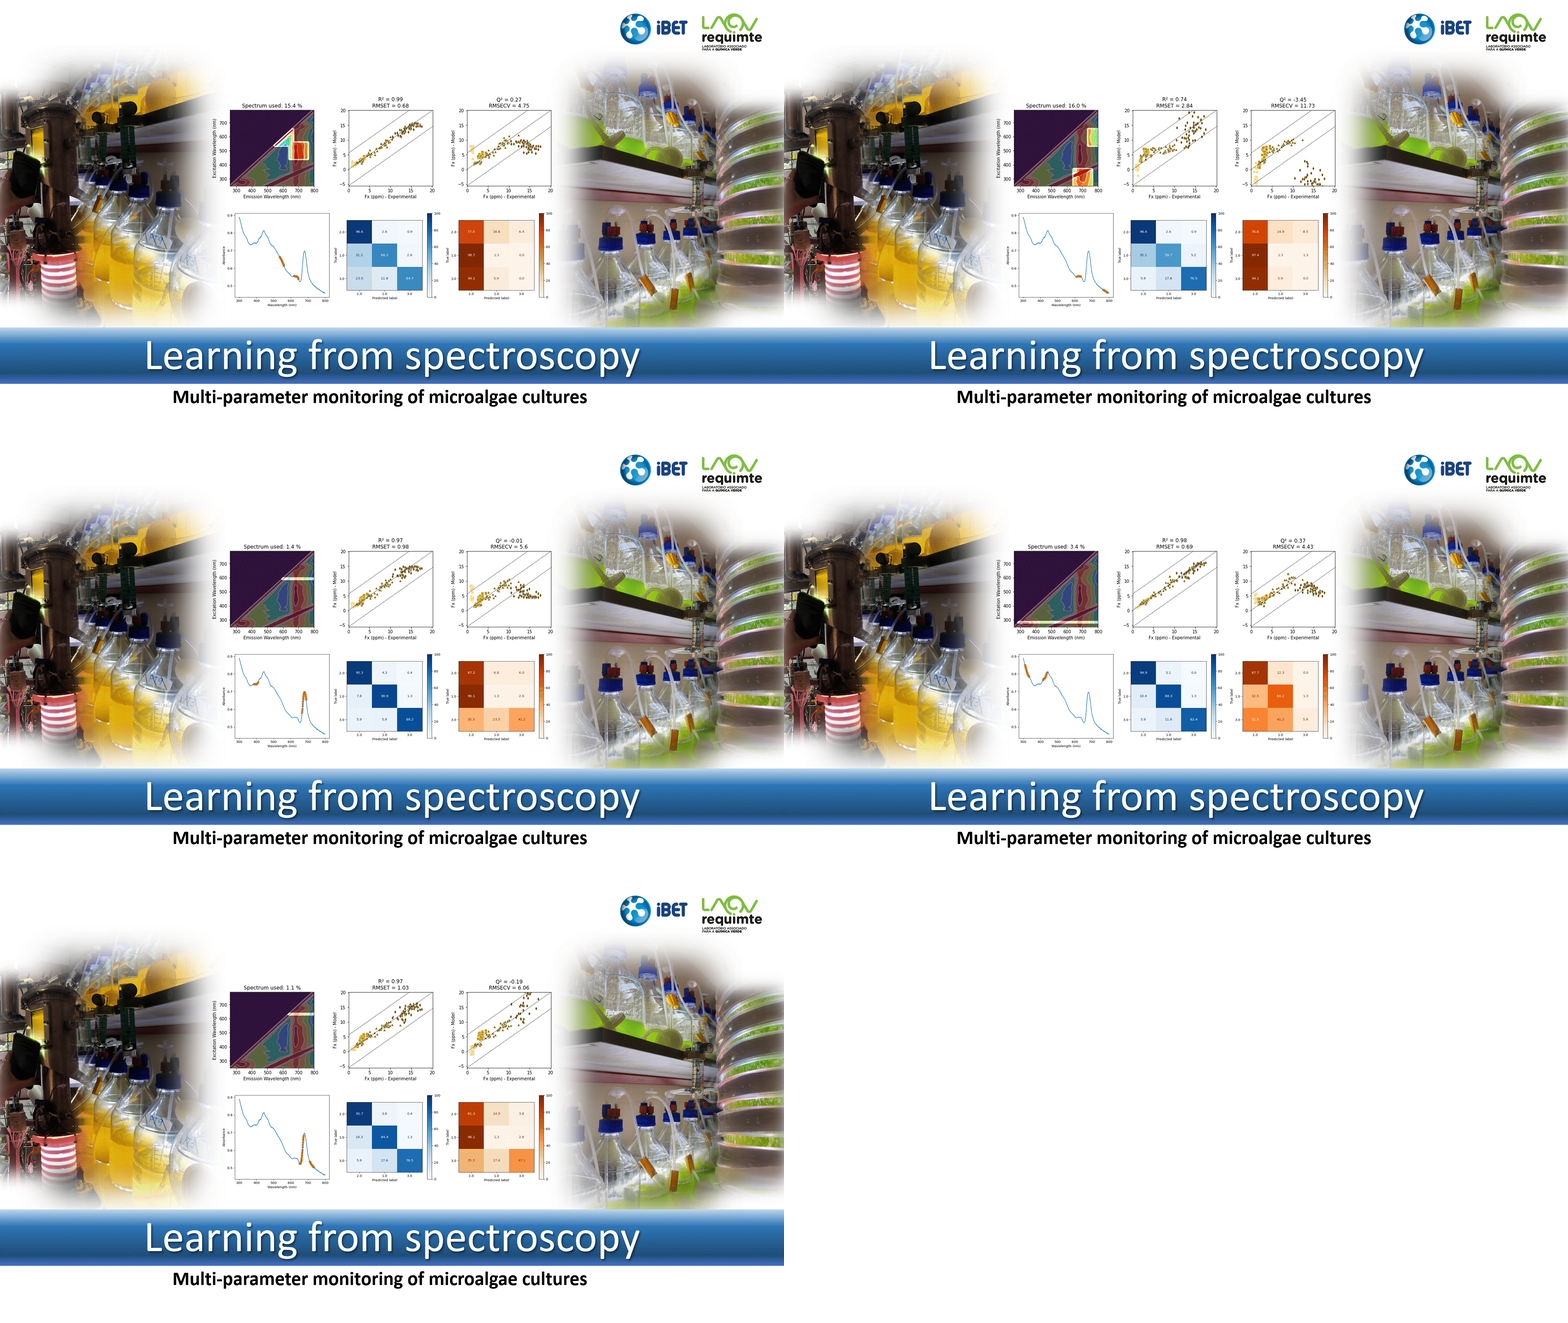
Here we use datasets from microalgae cultivation to learn how costly standard analytical data can be predict by inexpensive spectroscopy data.
Datasets: Phaeodactylum tricornutum and Nannochloropsis oceanica cultivations in aerated/illuminated flasks and/or airlift photobioreactor, monitored by standard analytical methods and spectroscopy
Observations state information obtained by culture sample analysis.
The analysis was performed by standard analytical methods (monitordata.xlsx) and by three spectroscopic methods: absorbance (absdata.xlsx), 2D-fluorescence (fluorodata.xlsx), and a low cost mini-spectrophotometer (Hamamatsu) for fluorescence (fluorominispecdata.xlsx)
All .xlsx files start with the same 10 columns of IDs for the observations.
monitordata contains monitor variables of interest, measured by standard analytical data: cell concentration CC (M/mL), single-cell auto-fluorescence CytoRed (a.u.) single cell size CytoFSC (a.u.), and total content in the main charateristic carotenoid (fucoxanthin Fx (ppm) for PT and violaxanthin Vx (ppm) for NO)
absdata contains 500 wavelengths of absorbance fluorodata contains 6103 excitation-emission wavelength pairs of fluorescence
Open the notebook for a step-by-step guide!

