




I'm an Information Systems student at The University of Texas at Arlington with a minor in AI in Business. I like projects where the work does not stop at cleaning a dataset—the result should explain an operational problem, support a decision, or become something people can actually use.
- Building ShiftRepair, a JavaFX shift-coverage recovery system with a four-person team
- Developing analytics and machine-learning projects with Python, SQL, Power BI, Tableau, and Excel
- Interested in data analyst, business analyst, technology analyst, and operations analytics opportunities
- Currently expanding into APIs, cloud data workflows, and applied machine learning
| 539K+ flight records analyzed |
425K+ model training records |
24K+ job postings studied |
4-person development team |
Live project pulse


|
A JavaFX system designed to help managers recover coverage when an employee calls out. It combines eligibility checks, scheduling constraints, ranked replacement options, timed offers, and recovery tracking in one workflow. My focus: interface architecture, manager and employee workflows, GitHub integration, and project coordination
|
A classification case study estimating whether a basketball shot will be made. I prepared 425K+ training records, engineered defender-pressure features, compared decision-tree configurations, and evaluated performance with log-loss and ROC AUC. Result: selected an interpretable 63-leaf model that improved holdout log-loss
|
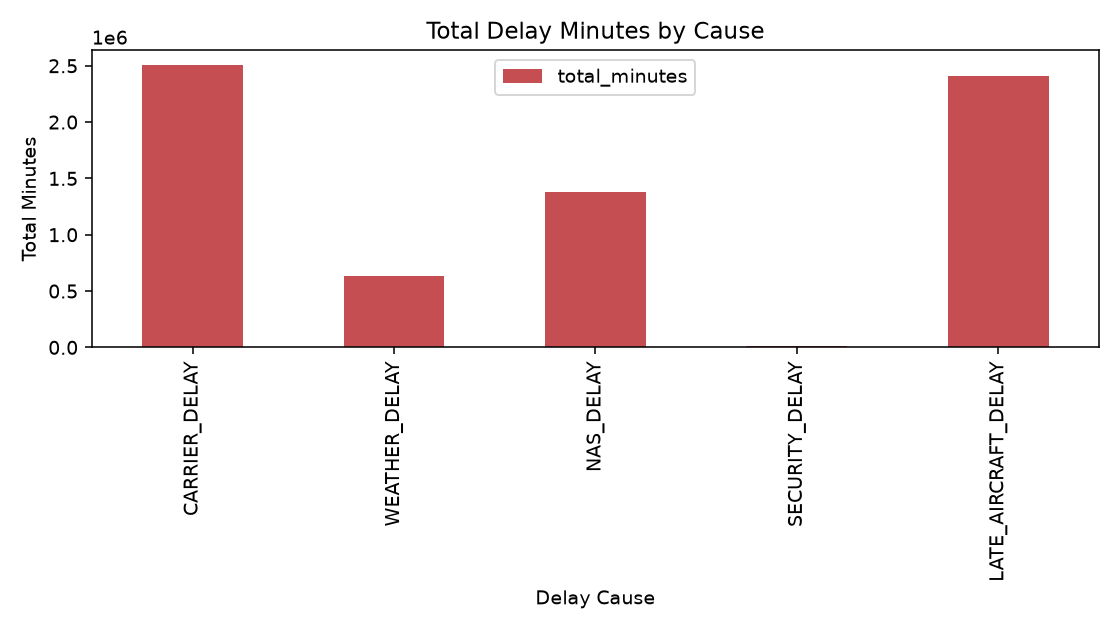
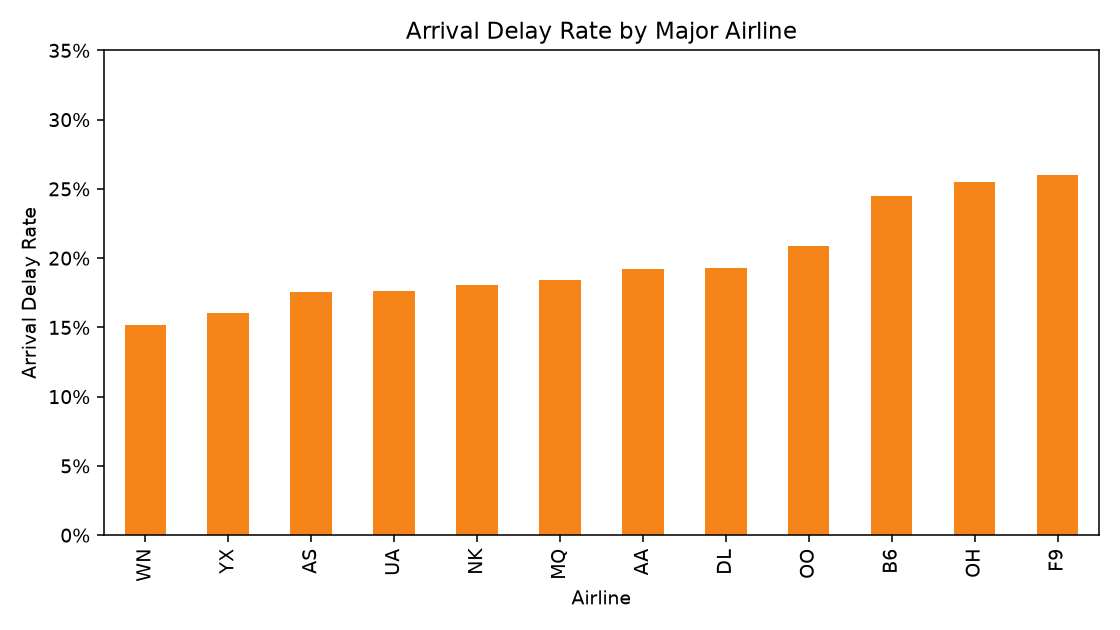
Analyzed 539K+ U.S. flight records to study airline, airport, route, cancellation, and delay performance. The project includes a repeatable cleaning workflow, automated data-quality checks, a SQLite analytical layer, SQL KPI queries, and an interactive Power BI report in development.
What I worked on: operational KPIs, time-based delay patterns, route performance, data validation, and dashboard development
Python pandas SQL SQLite Power BI
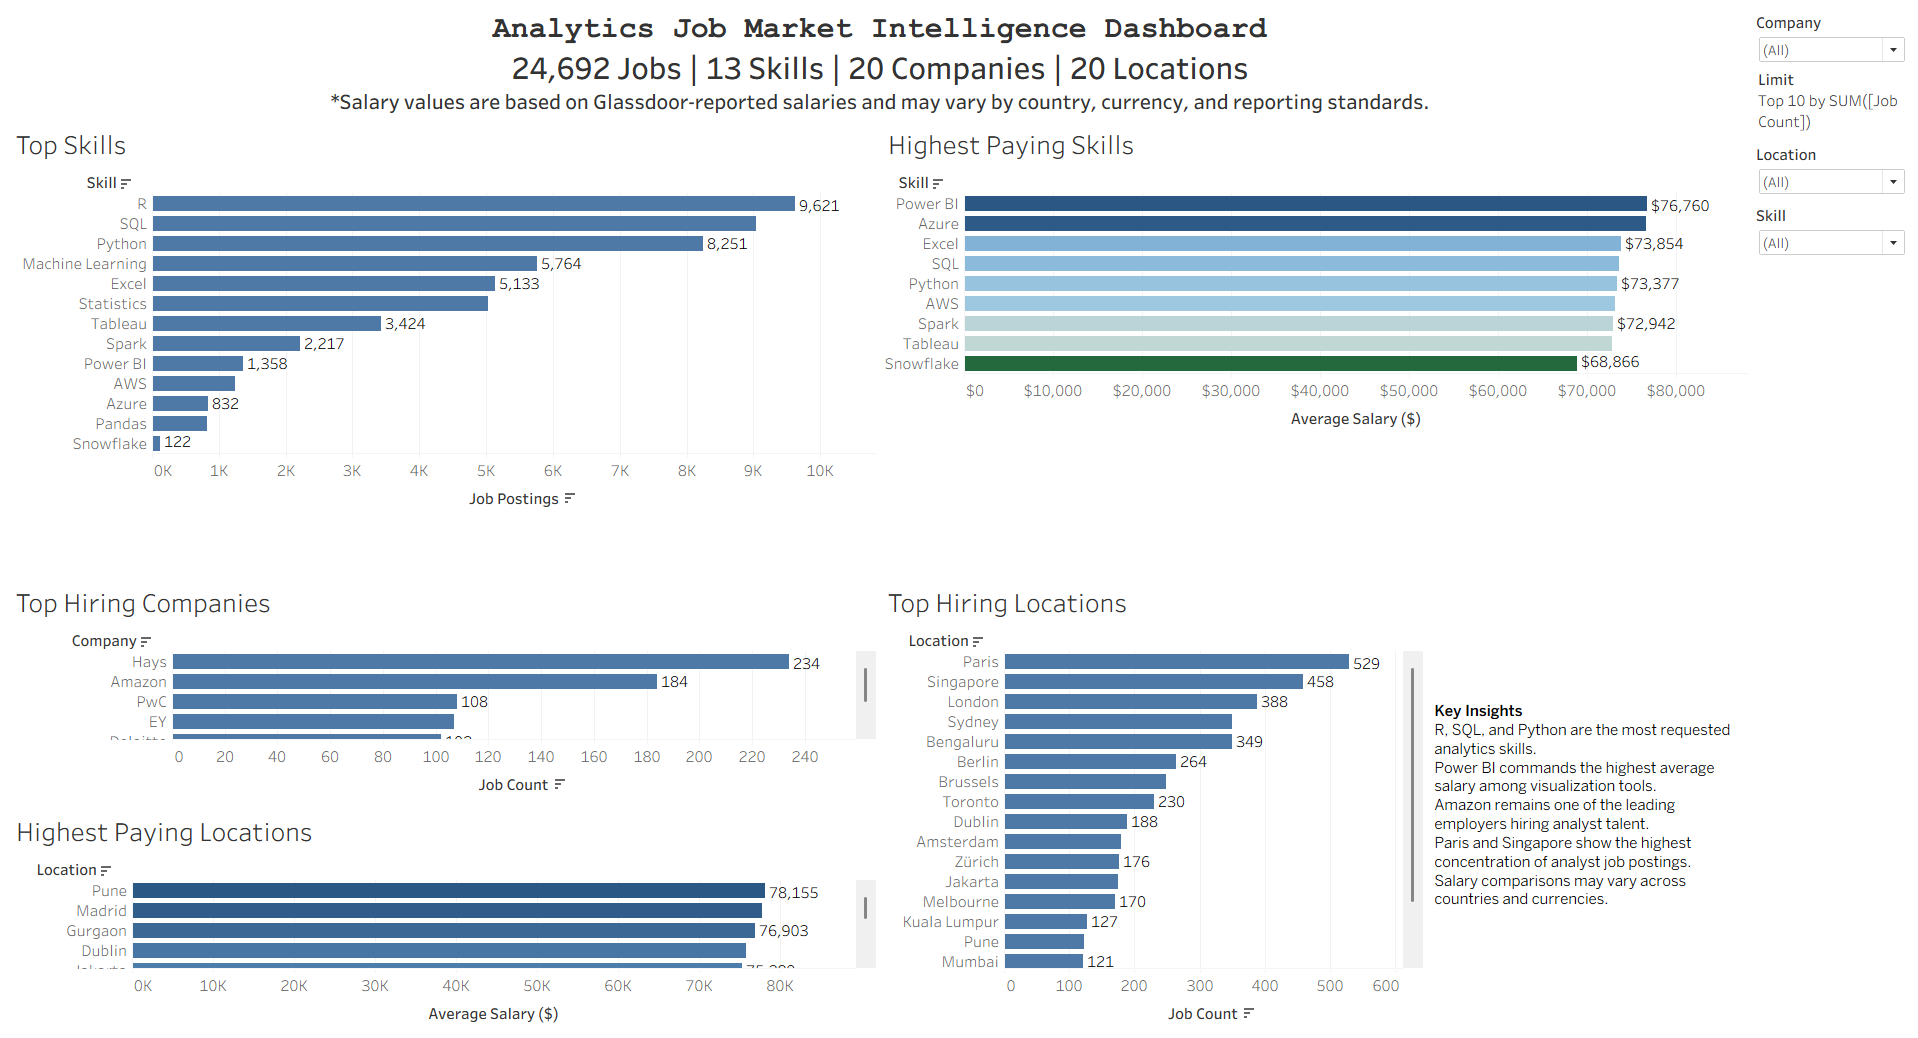
Analyzed 24K+ analyst job postings to compare requested skills, salaries, employers, and locations. Python and pandas handle the preparation; Tableau turns the results into an interactive market-intelligence dashboard.
Python pandas Tableau Git
Compared quoted and billed UPS and FedEx costs, calculated invoice variance, flagged possible overcharges, and summarized delivery performance by carrier.
Python pandas Data Validation


| Project | Current focus | Next milestone |
|---|---|---|
| ShiftRepair | JavaFX manager and employee workflows | Complete the end-to-end recovery flow |
| Airline Operations Intelligence | Power BI report development | Publish the dashboard walkthrough |
| Analytics stack | APIs and applied ML | Build a source-to-dashboard pipeline |
