Demonstrate how to use Dask+Holoviews to show RA, Dec density map#158
Demonstrate how to use Dask+Holoviews to show RA, Dec density map#158wmwv wants to merge 20 commits into
Conversation


|
@cwwalter I added some more pedagogical material giving more details of Dask vs. Pandas DataFrame comparisons with discussions of I rewrote the star truth table comparison to no longer use GCRCatalogs and instead just directly read the star truth table parquet file into a Pandas DataFrame. |
|
@cwwalter Will you have a chance to look at this PR in the next week? |

 cwwalter
left a comment
cwwalter
left a comment
cwwalter
left a comment
There was a problem hiding this comment.
Looks good. There are specific pedagogical / code comments below.
I think my only general comment is that this notebook is mixing two (or three) semi-complicated things to learn together, sky projection, using holoviews for interactive plotting/rastering, and dask. So here are some things you might think about, take them or leave them as you will.
I think, that the thing you need to spend a lot of your time on to work through the notebook is the non-dask code part and, because of that some of what you are doing with dask is a bit subsumed. I'm not sure if people will really come away with a handle on the dash board, persist etc. I think especially with some of the added sections at the end, the focus is more on those other parts.
It might be worth considering building up to this in three notebooks:
- Basic Dask Into
- Basic holoview plotting (not necessarily using dask)
- Sky projection etc using dask and holoviews.
| "metadata": {}, | ||
| "outputs": [], | ||
| "source": [ | ||
| "client = Client()" |
There was a problem hiding this comment.
I suggest doing this to be explicit about how many cores and the amount of memory you are using.
from dask.distributed import LocalCluster

cluster = LocalCluster(n_workers=6,
threads_per_worker=1,
memory_limit='6Gb')

client = Client(cluster)
Note you then need to tell people how to access the dashboard.
Related: you tell people to watch the 'Dask Dashboard when you zoom in and out.' But never explicitly tell people to start it up etc.
There was a problem hiding this comment.
I actually don't know how to access the Dask Dashboard for "Local" Dask cluster running on JupyterHub at NERSC. The proxy service URL seems to only work for a scheduler running on a compute Node, not on the JupyterHub Node.
Do you know?
There was a problem hiding this comment.
Yes, I put in in my notes for using dask. It took me a bit to figure out but say you were on cori16 (check by starting a terminal). Then it would be
cori16-224.nersc.gov:8787
replace 16 which which ever machine you are on.
There was a problem hiding this comment.
also.. when you put just a client line there you will see something like this
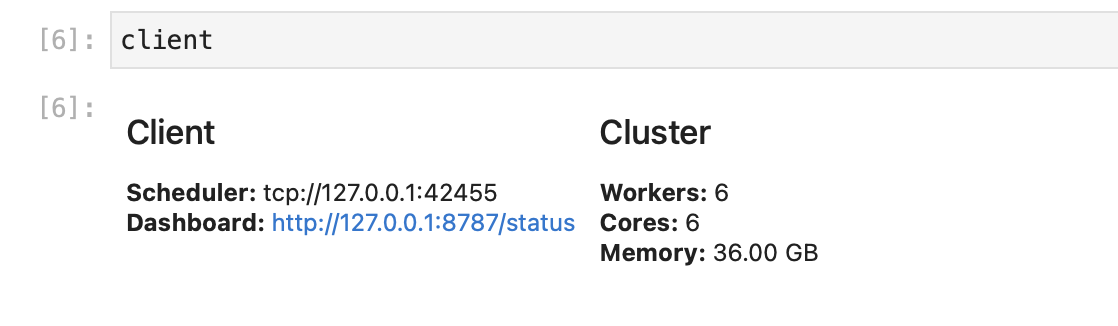
you are replacing the 127 part... if a bunch of people are using dask then the port might increment too.
There was a problem hiding this comment.
You don't want/need to use the proxy command thing in that case BTW.
There was a problem hiding this comment.
That URL gets me the link to the Notebook, but not the Dashboard.
There was a problem hiding this comment.
Specifically I am on cori16, the Dashboard was launched on 8787, but when I got to https://cori16-224.nersc.gov:8787/status
I get (after a long pause) the Notebook I'm looking at in a new window. But that only works once. Future clicking hangs and never loads.
There was a problem hiding this comment.
Hmm... I just looked at it :)
I think maybe it is not https: try just http:
There was a problem hiding this comment.
Woah... Yes http:// works. Thank you! I would never have figured that out.
There was a problem hiding this comment.
Great. FWIW, clue was the http://127.0.0.1 in the cell output.
| "metadata": {}, | ||
| "outputs": [], | ||
| "source": [ | ||
| "ddf = dd.read_parquet(data_path, columns=columns, engine='pyarrow', kwargs={'dataset': {'use_legacy_dataset': False}})" |
There was a problem hiding this comment.
I'm not sure what is going on with the kwargs here. Is it really necessary? Maybe explain that?
For pedagogical purposes something more like columns=selected_columns might be clearer.
There was a problem hiding this comment.
You're right. It's not necessary here. The kwargs dict with the "use_legacy_dataset": False
tells pyarrow to use the newer Arrow API, which has improvements related to filtering: it can now push filtering down to the read, both saving memory and allow for potentially faster reads if you're reading a small subset. But we're not really using this here.
| "outputs": [], | ||
| "source": [ | ||
| "# Save a PNG of the plot\n", | ||
| "hv.save(ra_dec, 'DC2_Run2.2i_DR6_ra_dec.png', fmt='png')" |
There was a problem hiding this comment.
Just a note that this didn't work for me since I didn't have the "selenium package" installed.
There was a problem hiding this comment.
Yeah, this fails on NERSC. It works fine for me locally. But, in general, actually saving plots from HoloViews+Bokeh is frustratingly fragile.
| "Cool! We did the projection, it ran across our workers and we can even zoom in/and out and it will dynamically rebin.\n", | ||
| "\n", | ||
| "But watch what happens with the Dask Dashboard when you zoom in and out.\n", | ||
| "\n", |
There was a problem hiding this comment.
Actually for me, I saw nothing happen on the dashboard, and wasn't even sure it was redoing anything. I realized later this was described above as not working in the juptyerlab environment, so I would change this text to say 'if...' or explain why they might not be seeing it.
| "metadata": {}, | ||
| "source": [ | ||
| "Ouch! I got 48 seconds on my 3GHz 8-core Xeon E5 desktop.\n", | ||
| "\n", |
There was a problem hiding this comment.
At NERSC this was 1 min 11 seconds. Since you used %%timeit instead of %%time, it did that 7 times. Ouch indeed! Because of this and all the following similar timing cases it takes a really long time to run through the notebook. Consider using just %%time.
| "cell_type": "markdown", | ||
| "metadata": {}, | ||
| "source": [ | ||
| "So, 36 seconds is a little better, but this is still _much_ slower than the 2.5 seconds when using all of the available cores with Dask." |
There was a problem hiding this comment.
I got 57 seconds at NERSC (compared to 1:11), so even less of a difference.
| "cell_type": "markdown", | ||
| "metadata": {}, | ||
| "source": [ | ||
| "## Are the divots above the bright stars?\n", |
There was a problem hiding this comment.
I think the meaning of divet might be lost on many.
| "metadata": {}, | ||
| "outputs": [], | ||
| "source": [ | ||
| "cat.list_all_quantities()" |
| "source": [ | ||
| "# We can use the same xticks, yticks <-> RA, Dec mapping as from above.\n", | ||
| "bright_stars_ra_dec = bright_stars_ra_dec.opts(xlabel='RA', ylabel='Dec',\n", | ||
| " xticks=major_ticks_and_labels_x, yticks=major_ticks_and_labels_y)" |
There was a problem hiding this comment.
I get:
NameError: name 'major_ticks_and_labels_x' is not defined
There was a problem hiding this comment.
Aargh. Sorry for not ensuring that this Notebook ran clean.
2 participants


Uses Dask+Holoview to visualize RA, Dec using a local Dask cluster.
Can you