Repository navigation
Conversation


…-clawbot#2193)

Months of hours should roll up to daily bars with a handful of labels,
missing hours count as zero, and the chart should start where the data
does rather than at the few old packets a short store keeps.

Co-Authored-By: Claude Opus 5.5 <noreply@anthropic.com>
Claude-Session: https://claude.ai/code/session_01KaR4xu8gVykQBkH8yG8m6H
…t#2193)

A long history now rolls up to coarser bars (hourly, 6-hourly, daily or
weekly; at most 180) with about 10 labels on round UTC times, missing hours
count as zero, and the title follows the bucket (Packets / Day). The chart
starts where the data does: a short store also keeps a few old packets
that were heard again, weeks before the rest.

Co-Authored-By: Claude Opus 5.5 <noreply@anthropic.com>
Claude-Session: https://claude.ai/code/session_01KaR4xu8gVykQBkH8yG8m6H
Every load fires a theme-refresh about 300ms after the theme resolves, and
the page re-rendered the current tab on it. On a slow or just-restarted
server the analytics answers land later, so the Overview was drawn from
the empty data object and threw (reading 'totalTransmissions').
loadAnalytics() renders the tab, with the current theme, once the answers
land, so the early refresh has nothing to do.

Co-Authored-By: Claude Opus 5.5 <noreply@anthropic.com>
Claude-Session: https://claude.ai/code/session_01KaR4xu8gVykQBkH8yG8m6H

 efiten
left a comment
efiten
left a comment
efiten
left a comment
There was a problem hiding this comment.
The rollup solves #2193. Two things before merge.
What I checked
- Bar counts: 2 years of hourly buckets give 105 weekly bars with 7 labels, 122 days give 123 daily bars, 7 days give 168 hourly bars. 24 h, 48 h and 72 h keep hourly bars with 6 to 8 labels.
- Time handling: missing hours count as zero, and the bucket math is in UTC epoch ms, so DST does not affect it. The hour keys match what the server sends (
tx.FirstSeen[:13],cmd/server/store.go:6572, fieldpacketsPerHour), with either separator. - Edge cases that work: a single bucket, all-zero counts, fewer than 7 days of data, and an outage at the end.
- Cost: about 10 ms per call on 2 years of hourly data, and at most 180 bars.
- Merge:
git merge-treeagainst current master is clean, including #2208, which also touchedanalytics.js. - Tests:
- The new test passes 7/7 and drives the real
analytics.js. test-all.shpasses, apart from the XSS-gate fixtures that need Python, which is not installed on my machine.
- The new test passes 7/7 and drives the real
Requested changes
-
The start crop also hides data inside a window the user picked (
public/analytics.js:86-88). The floor is relative to the recent days, so a genuinely quieter early period is cut, and nothing on the card says so. Measured with synthetic data:- 90 days, the first 30 at 1 packet/hour and then 100/hour: the chart starts 30 days late (61 bars instead of 91).
- 60 days, 20 quiet ones first: 20 days hidden.
- A steady ramp from 1 to 200 per hour over 120 days: about 11 days hidden.
The server already filters by window on
tx.FirstSeen(store.go:6640), so with 7d or 30d selected there are no stragglers to remove. The crop only has something to fix under "All data". Suggest:- apply it only when no window is set;
- show it on the card when it applies, for example "since MM-DD", so a cut is never invisible.
-
The theme-refresh guard has no test (
public/analytics.js:293-295). AGENTS.md asks for a regression test with every bug fix, and avmtest is small here: capture thetheme-refreshhandler, fire it with_analyticsData = {}, and assert that nothing throws andrenderTabis not called.The guard also skips theme refreshes on tabs that fetch their own data while the main load is pending. That is fine, because
loadAnalytics()re-renders when the data lands. One gap: ifloadAnalytics()fails (the catch at:303), theme changes no longer re-render any tab until a reload. The page shows "Failed to load" in that state, so the impact is small.
Notes, not blocking
- The edge bars are partial periods (
:91). Data that starts at 17h gives a first daily bar of 7 hours, and the last bar is the current, unfinished period. Both read as dips in traffic. - Weekly bars and 168 h label steps align on epoch weeks, which start on Thursday. Correct, but Monday would read more naturally.
- The comment at
:84says "the last seven whole days", butslice(-8, -1)takes the seven days with data before the last day with data. The behaviour is fine; the comment is not accurate. - The 2%, 1/10 and 180-bar thresholds are hardcoded. AGENTS.md rule 8 asks to note a later customizer step for those.
- The theme-refresh crash also happens on master without this chart. It is a separate commit (
98789131), which is good; mentioning it in the PR description would help whoever searches for that error later.
… alone

Regression test for 9878913. Drives init() with answers that never land,
fires the captured theme-refresh handler, and checks that nothing throws
and the tab is not re-rendered. Without the guard it fails with the
production error (reading 'totalTransmissions').

Co-Authored-By: Claude Opus 5.5 <noreply@anthropic.com>
Claude-Session: https://claude.ai/code/session_01KaR4xu8gVykQBkH8yG8m6H
…d says so

Review on Kpa-clawbot#2194: the start crop also cut a genuinely quieter early stretch
inside a window the user picked (90 days, the first 30 quiet: 30 days
hidden), and nothing on the card said so.

Co-Authored-By: Claude Opus 5.5 <noreply@anthropic.com>
Claude-Session: https://claude.ai/code/session_01KaR4xu8gVykQBkH8yG8m6H
In a picked window the server has already cut the data to it, so a quieter
early stretch is real: the chart now starts at the window's first hour.
Under "All data" the straggler crop stays, and the card title says
"since MM-DD" when it applies. The renderer gets the window the data was
fetched with from _analyticsData. Also corrects the comment on which seven
days set the floor.

Co-Authored-By: Claude Opus 5.5 <noreply@anthropic.com>
Claude-Session: https://claude.ai/code/session_01KaR4xu8gVykQBkH8yG8m6H

|
Review feedback addressed (commits 3fa23c3, 35df4dd, 3dd90ed):
Notes:
|

2 participants


Fixes #2193.
Problem
On an instance that keeps months of packets, the Overview tab's Packets / Hour chart becomes unreadable: 2,932 hourly bars in 720 units of plot, a date label every day, and the hours with no packets (which the server leaves out) squeezed off the axis.
Before and after
Both use the real
/api/analytics/rfanswer from the instance in the issue (2,933 hourly buckets over 124 days), served to the page in place of the fixture's own.Before (master, page on "All data"):
After, same data:
Phone: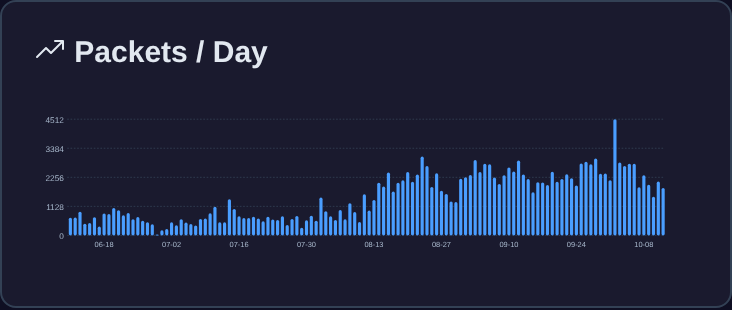
A short store (an instance holding 7 days in memory, plus a few old packets a day for weeks before that because they were heard again). The chart starts where the real data does (this shot predates the "since MM-DD" note now in the title when that crop applies):
Change
All in
public/analytics.js; no API change.packetsPerHourCard()replaces the inline block:theme-refreshabout 300 ms after the theme resolves, and the page re-rendered the current tab on it. When the analytics answers came later (a busy or just-restarted server), the Overview was drawn from an empty object and threwCannot read properties of undefined (reading 'totalTransmissions'). It now skips that refresh until the data has landed;loadAnalytics()renders the tab with the current theme when it does.The span is still picked by the page's time window.
Tests
tests/unit/test-issue-2193-packets-per-hour.js(intest-all.sh, red then green): 122 days gives 123 daily bars with 4 to 12 labels; 7 days gives 168 hourly bars; missing hours are drawn as zero; the chart starts at the data, not at the stragglers, and not after an outage; in a picked window nothing is cropped (90 days with 30 quiet ones gives 91 bars); a cropped chart says "since MM-DD" and an uncropped one does not; no data says so.tests/unit/test-analytics-theme-refresh-before-data.js(intest-all.sh): drivesinit()with answers that never land, fires thetheme-refreshhandler, and checks that nothing throws and the tab is not re-rendered. Without the guard it fails with the production error.sh test-all.shpasses; the Neighbor-graph filter E2E fails under CI load: skip-message transition is undone by a later re-render (#1758 lifecycle) #1925 neighbour-graph theme-refresh test and the analytics chart test still pass; the screenshots show no page errors and no sideways scroll at 1280 px or 390 px.Later
🤖 Generated with Claude Code
https://claude.ai/code/session_01KaR4xu8gVykQBkH8yG8m6H