Repository navigation
Conversation


|
I measured this on another deployment and it helps there too. Benchmark. I ran your
At our scale. Our production instance holds about 167k observations in memory, so this frees about 2.7 MB of heap there at no CPU cost. On a test server. I have run this PR, together with several others, on a staging instance replaying a day of production API traffic at real speed. After 13 hours there are no restarts and the heap is flat. Thanks for this one. 🤖 Generated with Claude Code |


…e) (#2169) > **Requires #2167 to be merged first.** This page calls the transport view API that #2167 adds (`/api/scope-audit?mode=transport`), so it cannot be split from it; until #2167 merges this PR also shows its commits. ## Summary Page half of #2142. **Stacked on #2167** (the API); review that first. #2171 adds the observer region filter on top. Partial fix for #2142 until all three are in. Adds a **Declared / Transport** toggle to `#/scope-audit`. The transport view calls `?mode=transport` and lists every repeater seen forwarding in the window: - **Seen carrying:** one chip per region scope with its packet count (first/last seen in the tooltip); - **Declared:** the repeater's declared regions coloured by whether they were seen carried (the declared view's own chips), or *not asked* when no declared-regions answer exists. Never asked is worded differently from declaring nothing; - **Other traffic:** unscoped, unmatched and ambiguous-hop counts. A **Region** box (suggestions from the scopes seen) adds a *Carries X* column, lists the repeaters not yet carrying it first, and summarises carriers against active non-carriers: the rollout report the issue asks for. Window, view and region are deep-linked (`#/scope-audit?window=7d&mode=transport&scope=be`) and survive a reload. The page says plainly that *transported* means seen carrying, not configured, and that over a short window a quiet region looks the same as a missing one. The intro text changes with the view. ## Screenshot The transport view with scope `be` typed in: every repeater seen forwarding in the last 24 h, whether it carries `be` (non-carriers first), the scopes it was seen carrying with counts, and its declared regions or *not asked*. Taken against `test-fixtures/e2e-fixture.db` with fictional `be` / `be-van` / `nl` scopes. 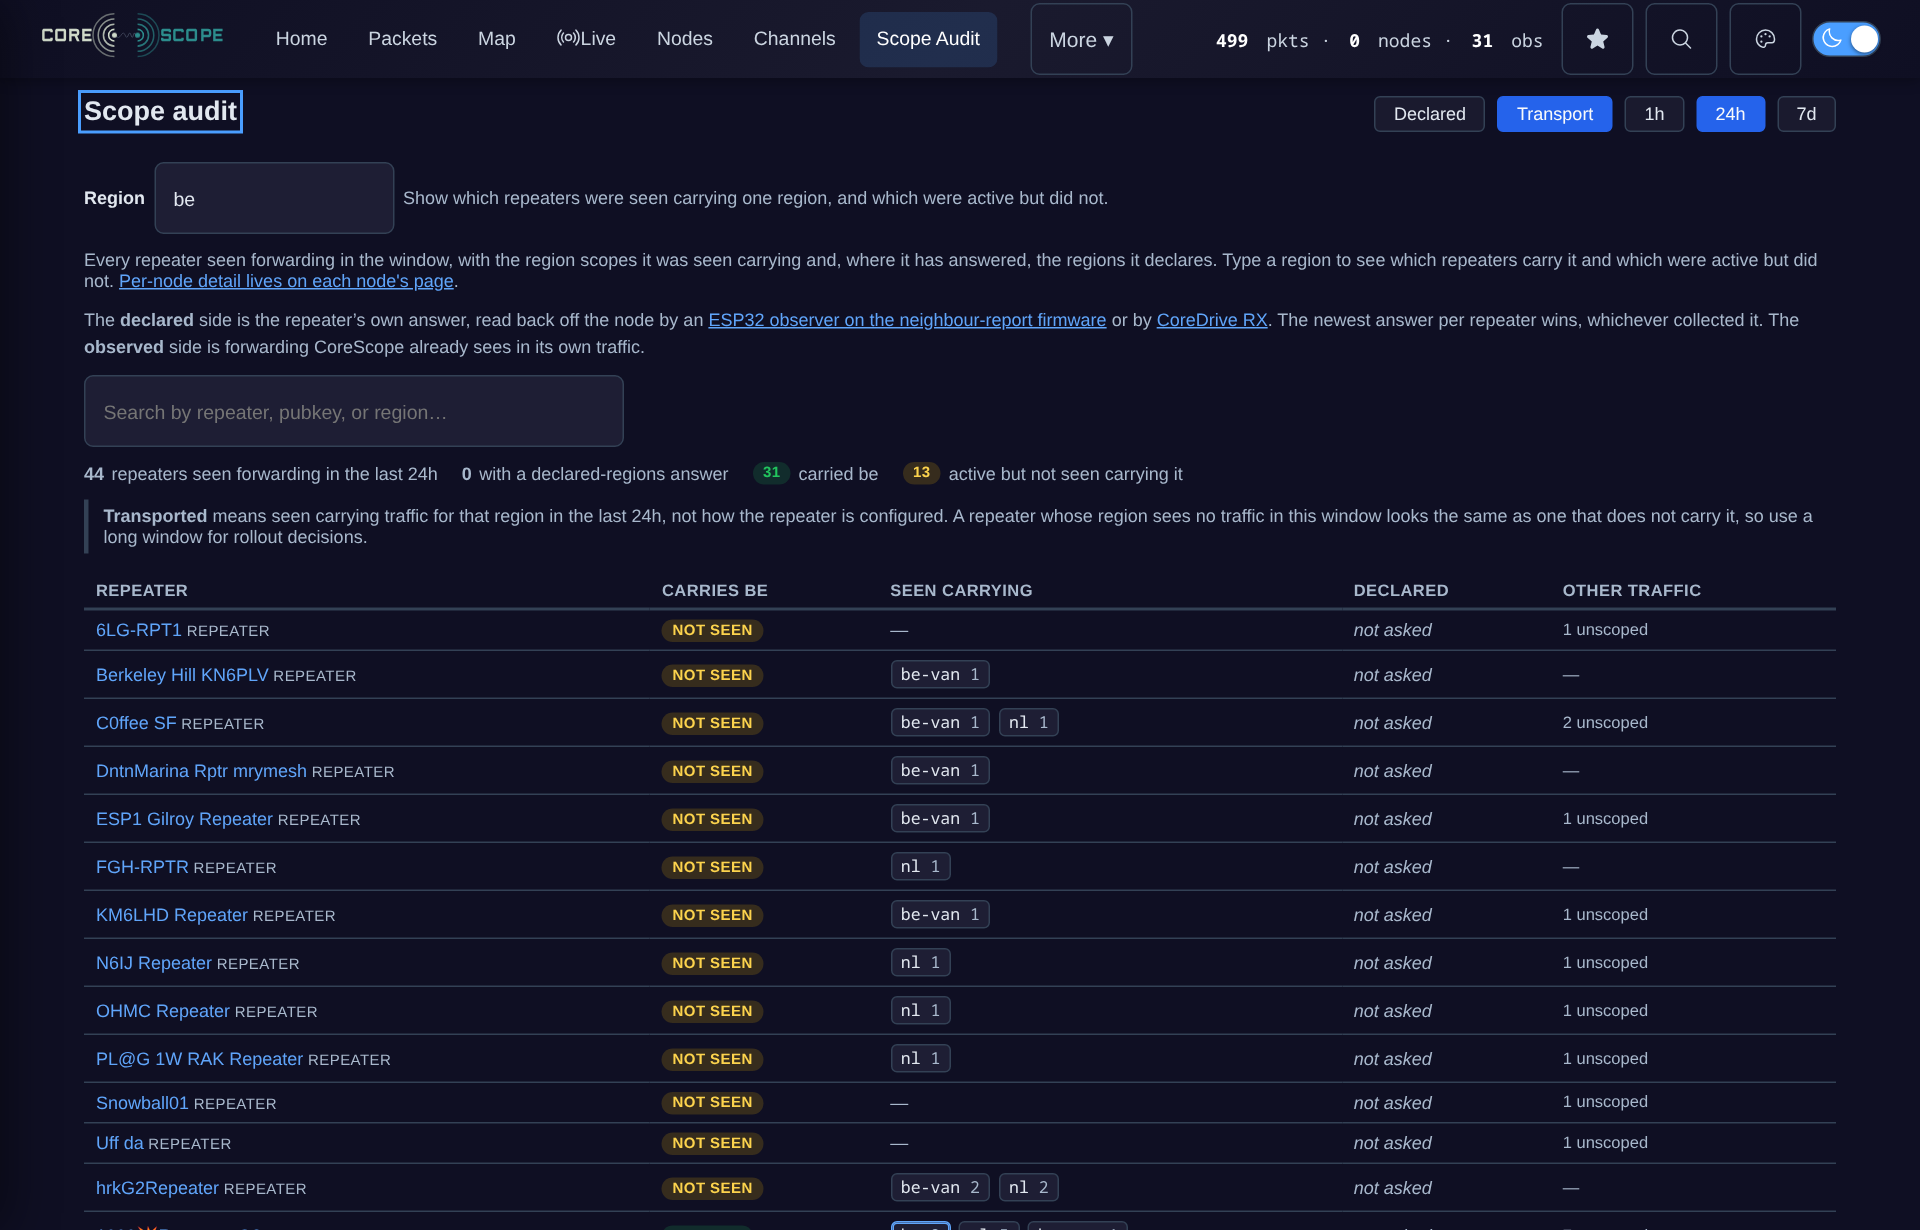 ## Browser validation (staging, real data) Headless Chromium against a staging copy of a production database with its live feed: - `#/scope-audit?window=24h`: the declared view, 16 rows, as before. - Clicking **Transport**: 385 rows; the hash gains `mode=transport`. - Typing a scope as `#XX-YY` in capitals: normalised to `xx-yy`; the hash gains it (now `scope=xx-yy`); summary "385 repeaters seen forwarding in the last 24h · 16 with a declared-regions answer · 51 carried xx-yy · 334 active but not seen carrying it"; the first rows are the non-carriers. - Reloading that hash restores view and region. Switching back to Declared hides the Region box and restores the declared intro. No page errors. - Checked at 1280 px and 390 px wide. Two layout bugs found this way were fixed before opening: the region box inherited `width: 100%` from `.nodes-search`, and `display: flex` overrode the `hidden` attribute on the region bar. ## Tests `tests/unit/test-frontend-helpers.js` gains 10 cases on rendered markup and state, using the page's exported internals like the existing scope-audit tests: hash and API paths (and that a region never leaks into the declared view's link), region normalisation (`#`, capitals, empty), *not asked* vs declared chips (with the `*` wildcard), carried-scope chips with counts and the filtered region marked, the carries column only with a region, HTML escaping of names, the summary counts, region suggestions, and the per-view intro. 768 passing in that file. Net-new UI surface, so per TDD.md the tests land in this PR rather than as a preceding red commit. Frontend suites on this branch: 193 of 194; the one failure, `test-issue-1956-release-routing.js`, needs CI's `GITHUB_REF_NAME` and fails identically on `master` locally (#2149 and #2160 address that). ## Review notes - Colours only through existing CSS variables (no hex literals); the filtered region is marked with the link colour, not a new status colour. - The window note's wording is in the same spirit as the declared view's `windowHonestyNote`. - No API calls per row: one request per view/window/region, cached client-side for 30 s like the declared view. ## SonarLint SonarQube Community rules (the SonarLint engine) were run on the files this PR touches, and only issues on lines it adds are listed. - **Fixed** in `df53e770`: - one `modeQuery` helper for the page hash and the API path (S3358; the two copies were identical); - the carries-scope cell built before the row (S3358); - `localeCompare` for the region suggestions (S2871), `for…of` and `.dataset` (S4138, S7761), optional chaining (S6582); - object spread in the helper tests (S6661). - Optional chaining and spread are already used throughout `public/`. No behaviour change. ## Checked against the repo rules - Rebased onto `master` (`673442cc`). Each red commit was re-run and still fails on its assertions; each green commit passes (TDD.md). - `make test`: all 16 modules pass. Frontend suites: all pass except `test-issue-1956-release-routing.js`, which needs CI's `GITHUB_REF_NAME` and fails the same way on `master` locally (#2160 addresses it). - No private data: test fixtures and examples use the codes the existing tests use (SJC/SFO/LAX, `#be`-style scopes). - No new `map[string]interface{}`, no hard-coded colours. `git add` was explicit, and there is one logical change per commit. 🤖 Generated with [Claude Code](https://claude.com/claude-code) https://claude.ai/code/session_01KaR4xu8gVykQBkH8yG8m6H --------- Co-authored-by: Claude Opus 5.5 <noreply@anthropic.com>

|
The product change is fine and the benchmark confirms it (192 retained B/obs locally, matching your figures and A13xB0's). #2160 is now merged as a5b60ca. This branch still carries the older copy of that test commit (2403d28), and it conflicts with master in |
Refs #2148.

## Problem
`StoreObs` is the store's most numerous struct: 400k of them on a week
of a busy regional network. Its lazy timestamp cache (#1481) is a
`time.Time`, a `sync.Once` and a `bool`, together 40 bytes. On current
master that makes the struct 200 bytes, which puts every observation in
the 208-byte size class.

## Change
The cache is now a single `atomic.Int64`:
- `0` before the first call;
- the parsed time as UTC nanoseconds after it;
- or one of two sentinels: one for empty or unparseable strings, and one
for times it can't hold exactly (a non-UTC offset, or outside
`UnixNano`'s range). Those are re-parsed on each call so their location
is preserved.

Concurrent first calls may both parse; they store the same value.
`StoreObs` is now 160 bytes, in the 160-byte size class: 48 bytes × 400k
observations ≈ **19 MB** less heap. The first parse costs the same;
cached reads now build the `time.Time` from an int.

## Tests
- `TestStoreObsFitsIn160Bytes`: red commit first.
- `TestStoreObsParsedTimeMatchesParse`: Z, nanosecond, offset, SQL,
empty, garbage and epoch inputs give the same time and location as
`time.Parse`, on the first and the cached call.
- `TestStoreObsParsedTimeConcurrentFill`.
- The existing `storeobs_parsedtime_test.go` still passes.
- `go test ./cmd/server` passes, and `-race` passes on the ParsedTime,
retransmission and observer analytics tests.

## This PR or #2149
#2149 fixes #2148 by reordering these same three fields. The two
conflict, so here is how they compare. Sizes are
`unsafe.Sizeof(StoreObs{})` on each branch, with Go's heap size class
beside them:

| | struct | heap per observation | saved per observation | saved at
400k observations |
|---|---|---|---|---|
| master | 200 B | 208 B | – | – |
| #2149 (field reorder) | 192 B | 192 B | 16 B | ~6.4 MB |
| this PR (one 8-byte field) | 160 B | 160 B | 48 B | ~19 MB |

- **#2149:** a pure field reorder with no change in behaviour. It is the
smallest, safest change and the easiest to review. It saves a third of
what this PR does.
- **This PR:** three times the saving, but more code. It adds two
sentinel values, and re-parses on each call any timestamp with a non-UTC
offset. The store writes UTC (`Z`), so that path is rare. It is tested
against `time.Parse` on edge cases, concurrently, and under `-race`.

Options:
1. **Take this PR.** #2149 then has nothing left to reorder.
2. **Take #2149 now, and this PR after it** as a follow-up for the
further 32 bytes per observation. I'll rebase onto #2149 if it lands
first.
3. **Take only #2149** if the smaller, simpler change is preferred.

No config or UI changes.

🤖 Generated with [Claude Code](https://claude.com/claude-code)

https://claude.ai/code/session_01KaR4xu8gVykQBkH8yG8m6H

---------

Co-authored-by: Claude Opus 5.5 <noreply@anthropic.com>

|
Thanks for the review. I rechecked this against current master before acting on the rebase request. #2196 has since merged as That makes the product change here superseded; rebasing the old representation would not add a useful improvement. I recommend closing this PR as superseded by #2196, rather than keeping it in the merge queue. This is supersession, not a claim that this PR itself was merged. The retained-through-GC benchmark is still potentially useful as a separate measurement in #2152. Any preserved results should retain their original revision/platform labels. The earlier duplicate #2160 test commit should not be carried into another branch. |
|
Closing this as superseded by merged #2196 ( Current upstream replaces the timestamp-cache fields this PR reorders with a single atomic value and enforces a 160-byte struct ceiling. Rebasing this older 192-byte layout would add no useful change. Issue #2148 is already closed. The original branch and retained-object benchmark remain available for reference. Its measurements still describe the original revisions; this closure does not claim that #2149 itself was merged. The duplicate test-portability commit belongs to the already merged #2160. |



Fixes #2148.
Pack the private cached timestamp fields in
StoreObsso each observation fits a smaller Go allocation class. This changes field layout only; access remains O(1), with no extra per-packet work, cache or configuration.Measured with Go 1.27.2 on Windows/amd64 against upstream
9dbc287:The live-store figures are medians of three runs per revision: 1.55 MiB / 1.66% lower, with identical counts and content digests and zero evictions. The included benchmark retains its objects through GC; a regression test enforces the 64-bit size budget.
Validation: full server and ingestor suites, standalone frontend suites, focused race tests, and 149 browser checks. The browser suite retains its existing disabled/data-dependent cases. The Windows symlink capability limitation was covered by the complete Linux ingestor suite.
A separate commit repairs three local test-environment assumptions without changing production behavior. Post-push browser checks confirmed packet filtering, historical data and observation switching with no console errors. Linux CI passed, including all browser shards and both image architectures. These measurements do not establish Linux PSS or large-instance capacity savings.