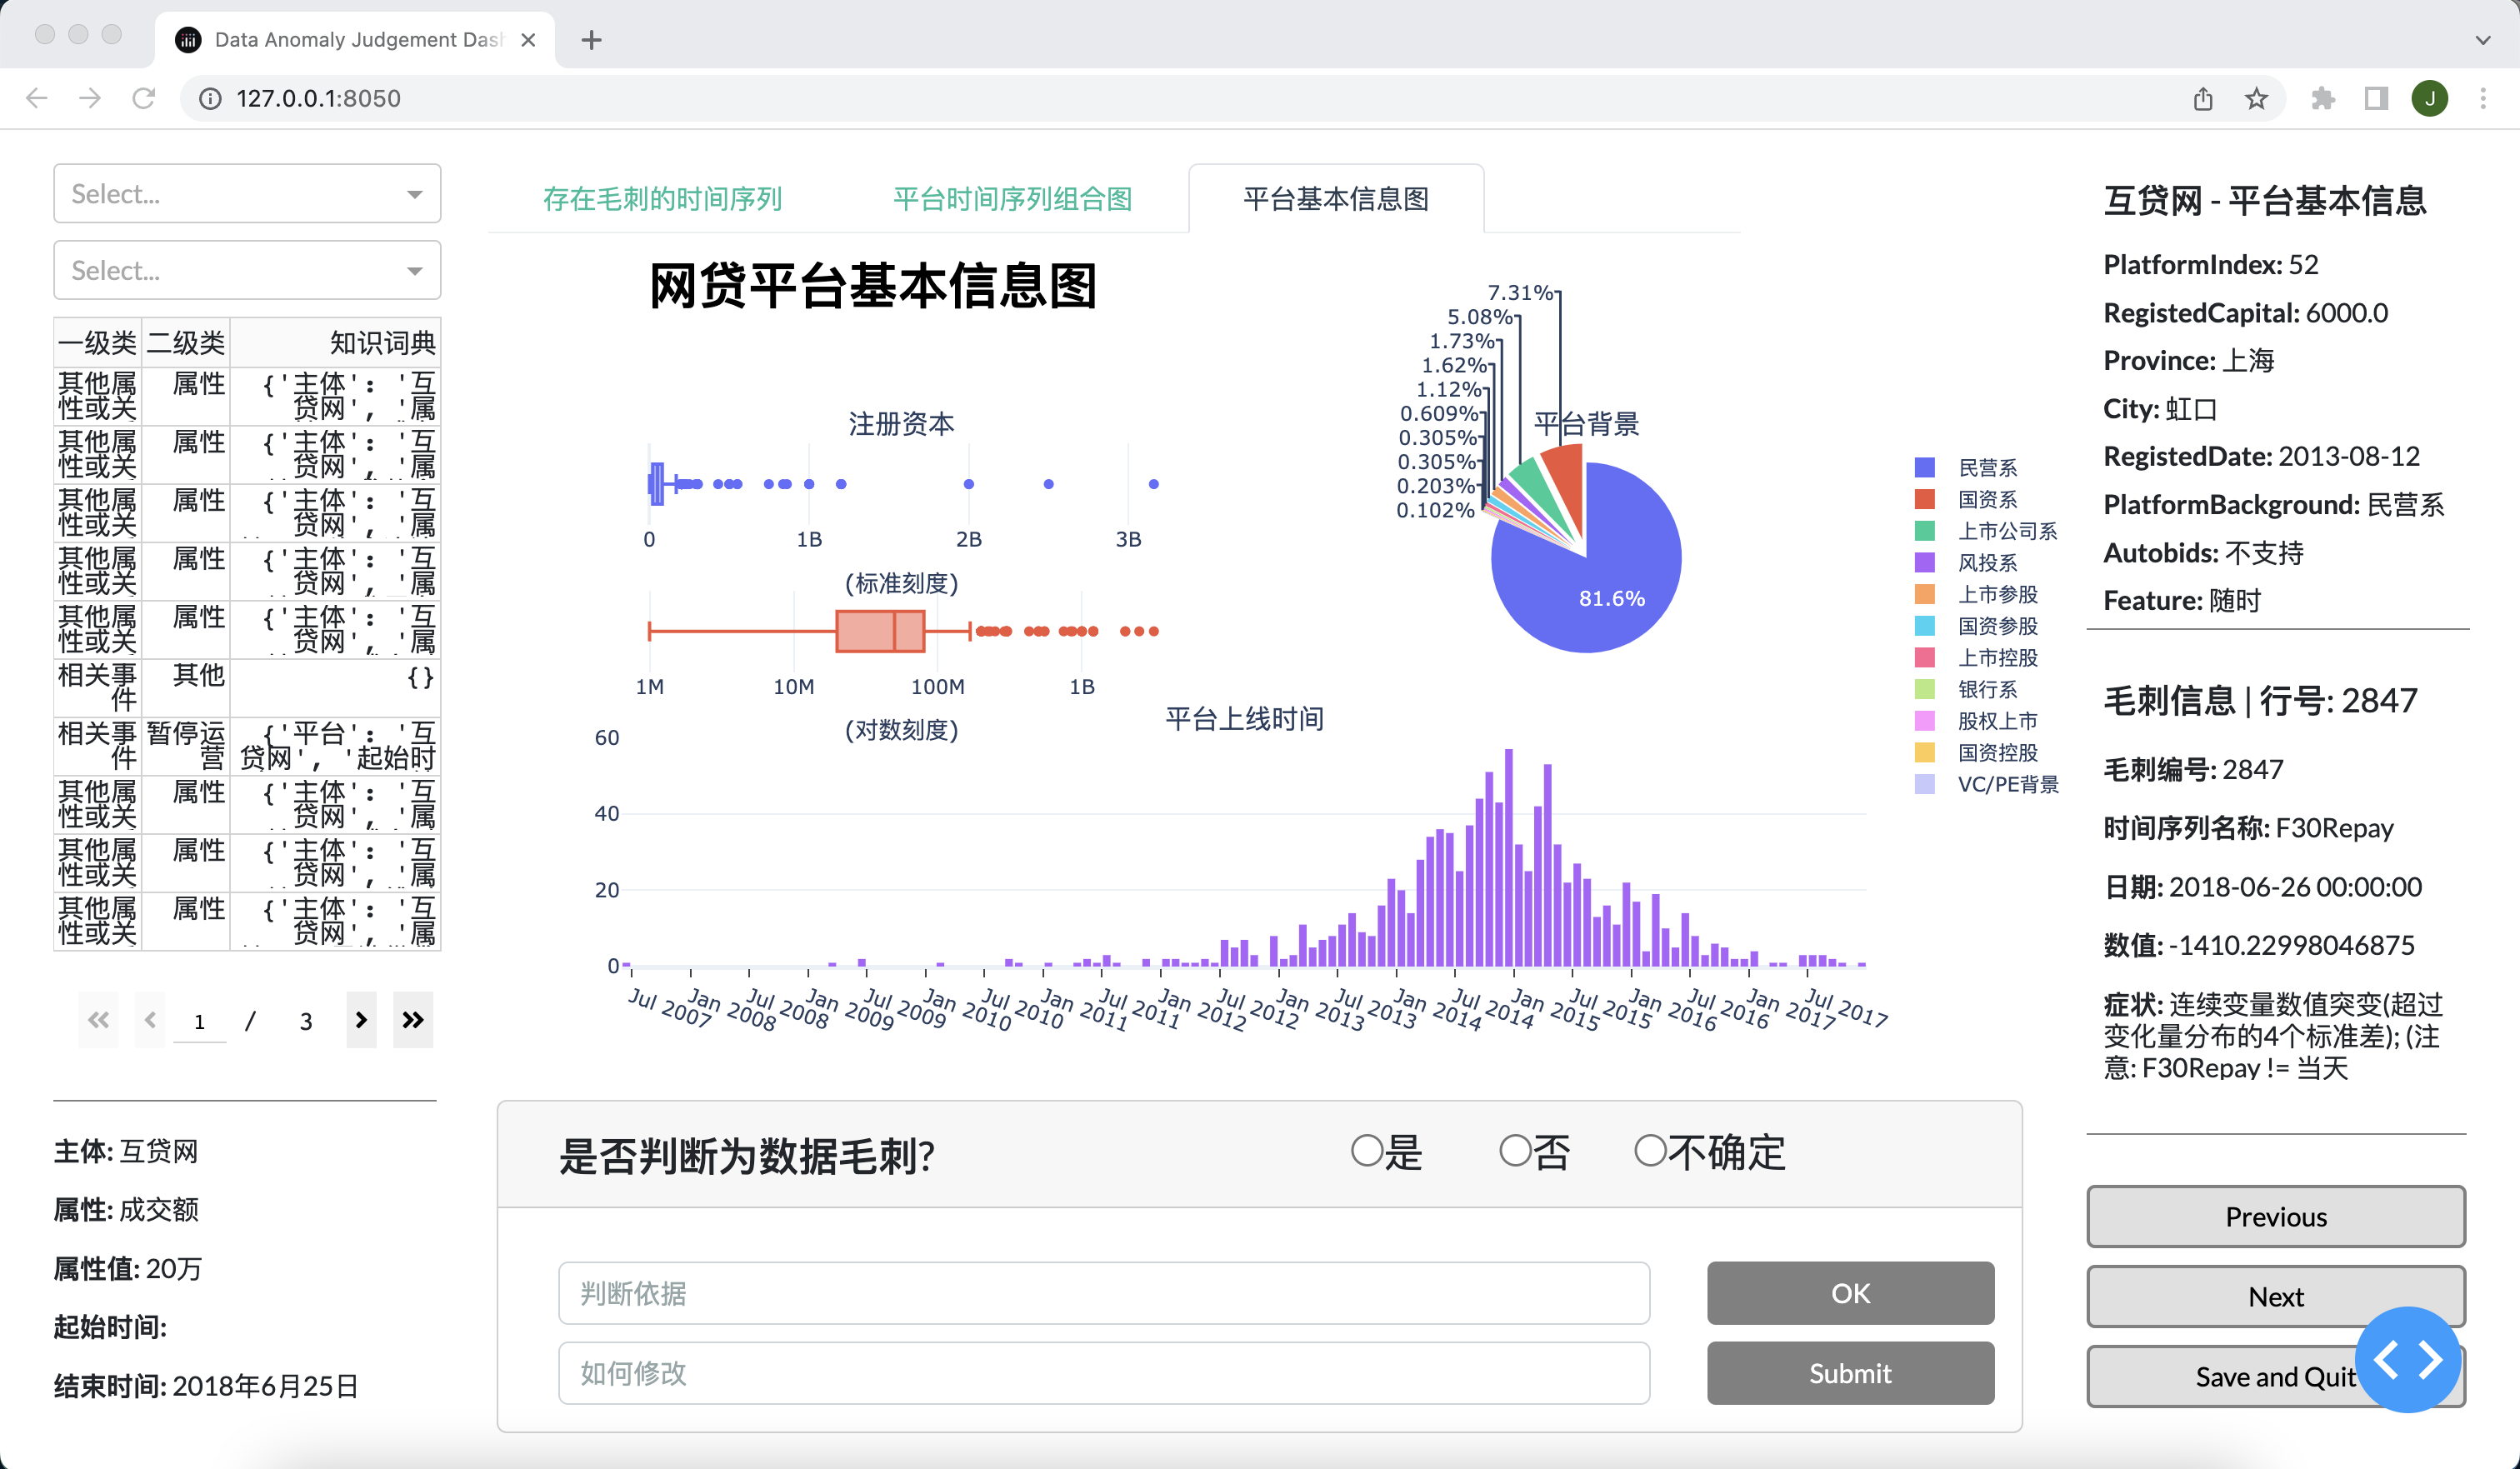
Anomaly-judgement-GUI is a graphical user interface built using the Dash framework in Python. It presents suspected abnormal data points to the user, providing all the relevant information needed for the judgement process. The user can then determine whether the data point is abnormal or not, and the result is automatically written to an Excel file.
- Intuitive and user-friendly interface Clear and concise presentation of data points
- Automated Excel file writing, reducing the risk of human error
- Navigation buttons for easy movement between data points
- Input fields and radio buttons for user judgement, with automatic enable/disable logic based on user input
-
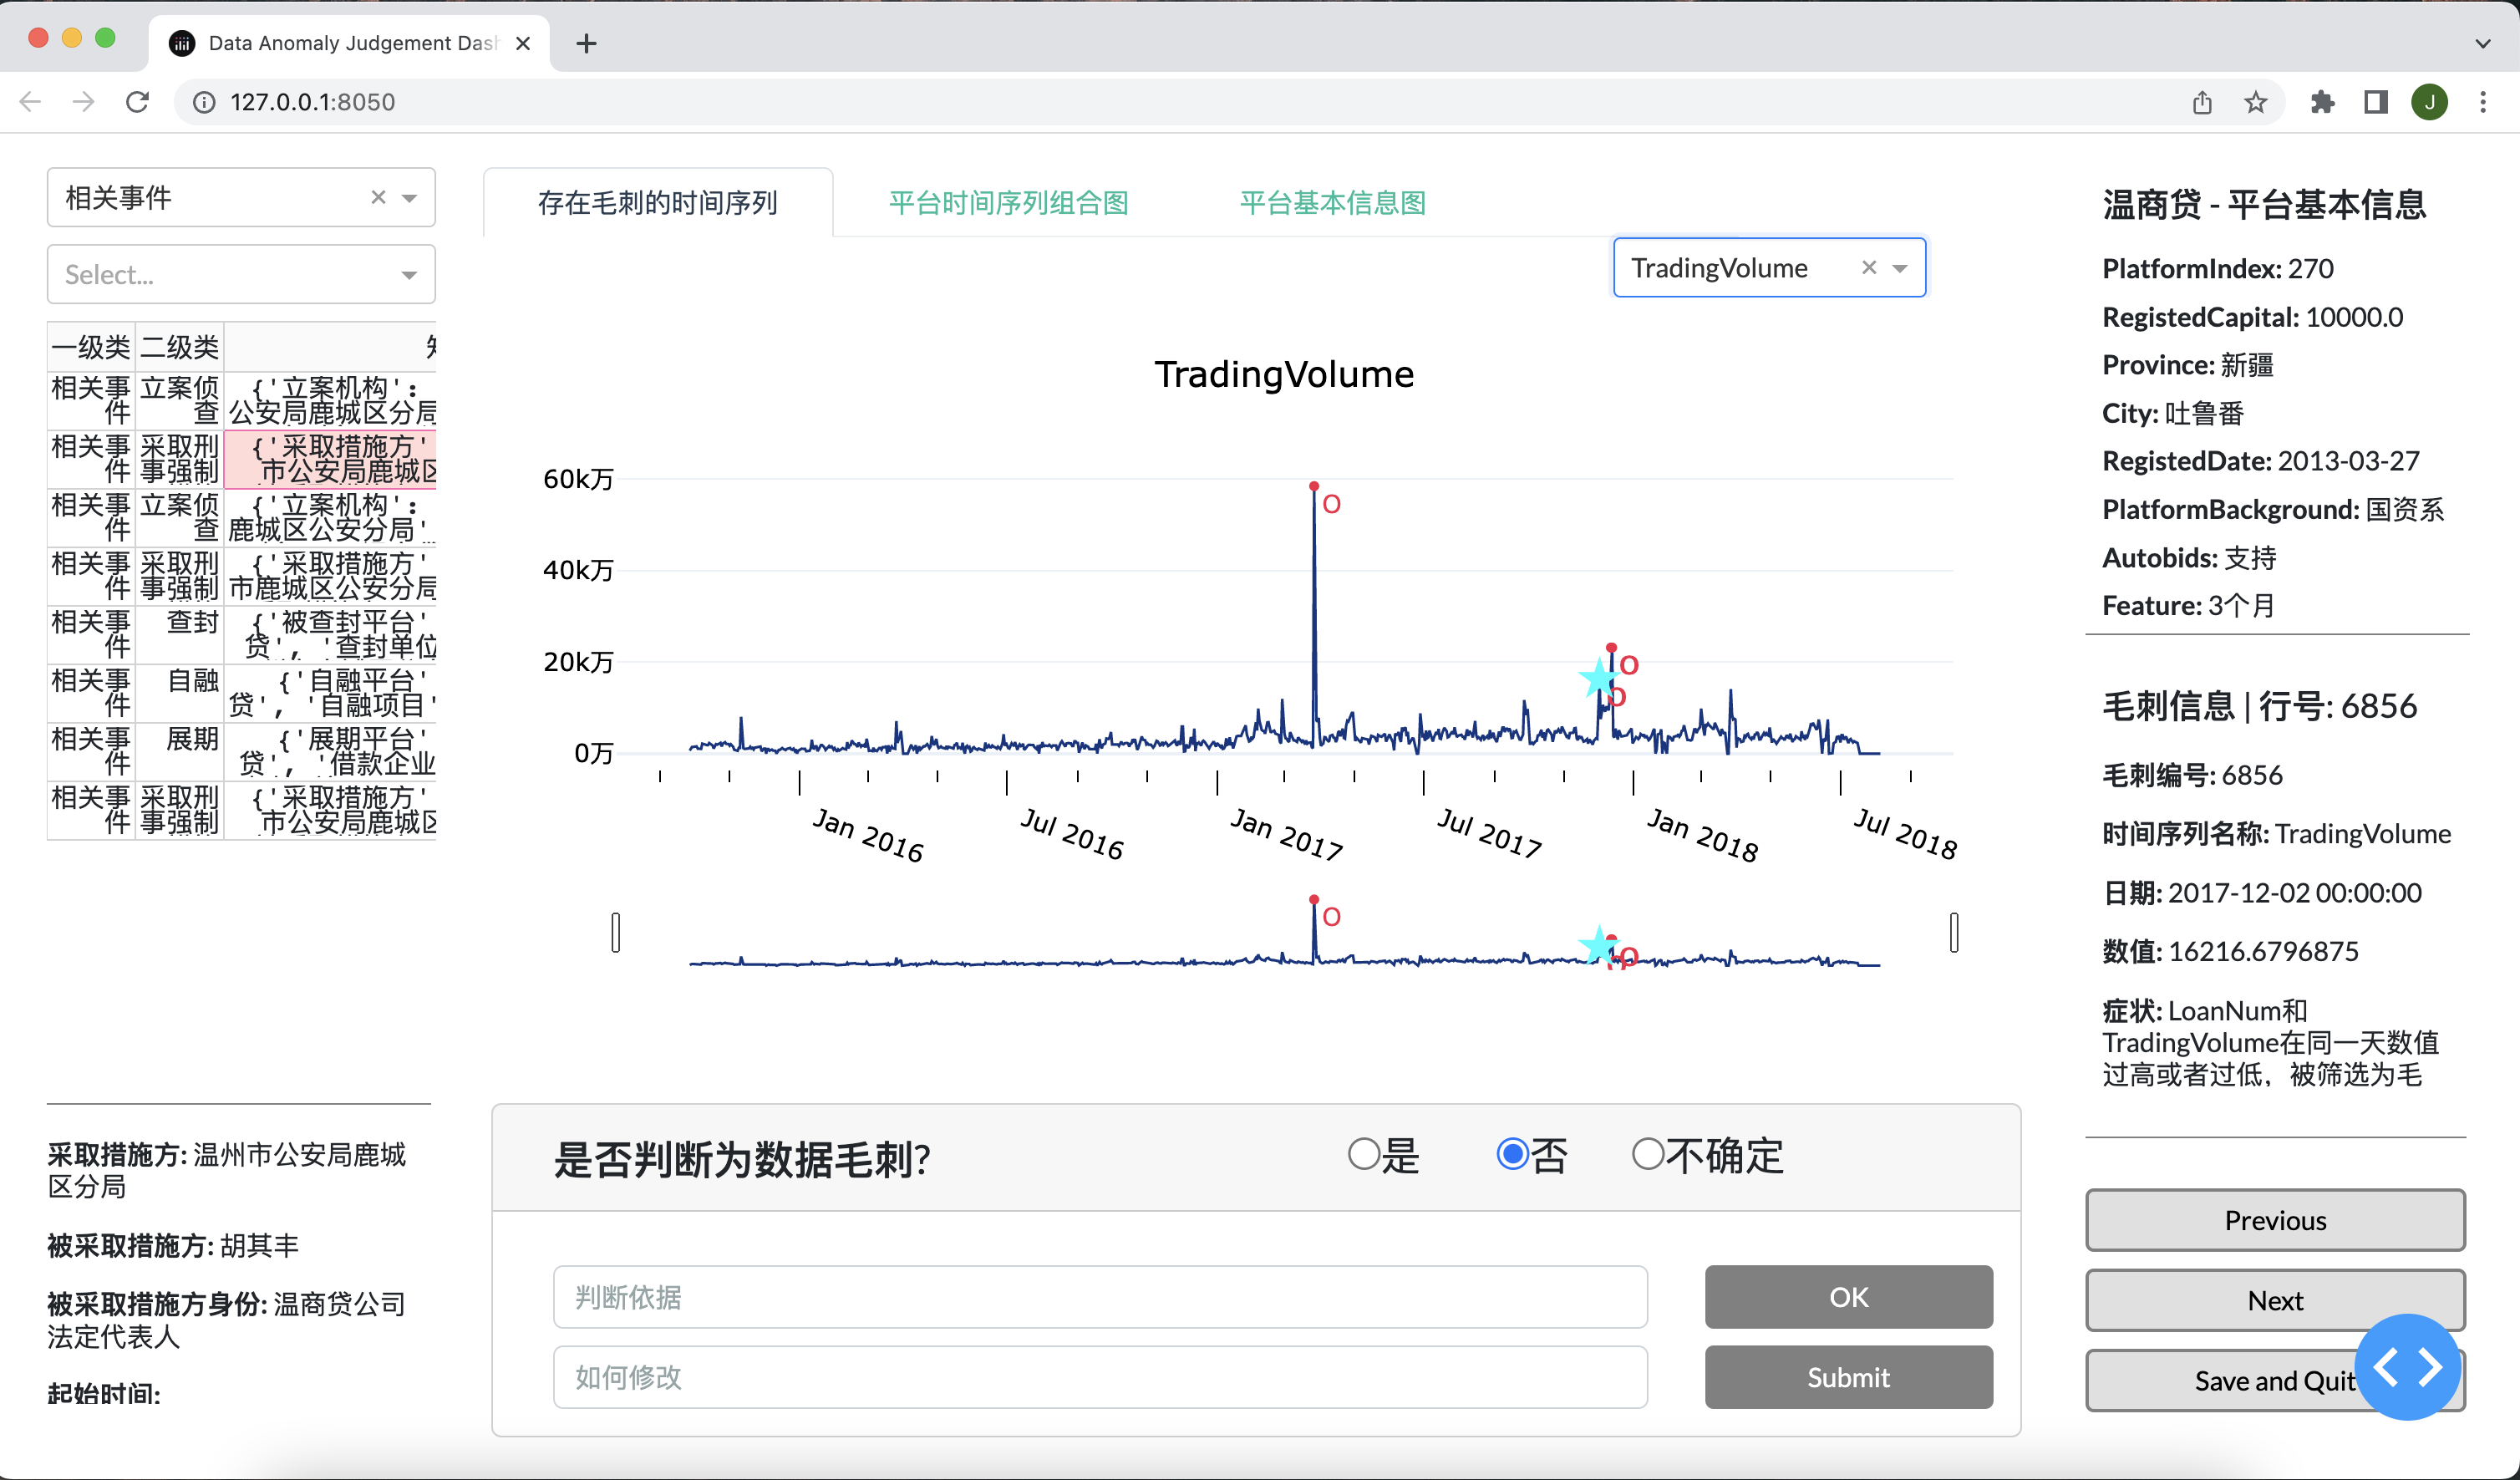
Interactive plot indicating the anomaly point with a slidebar on x-axis for the feature selected by the user
-
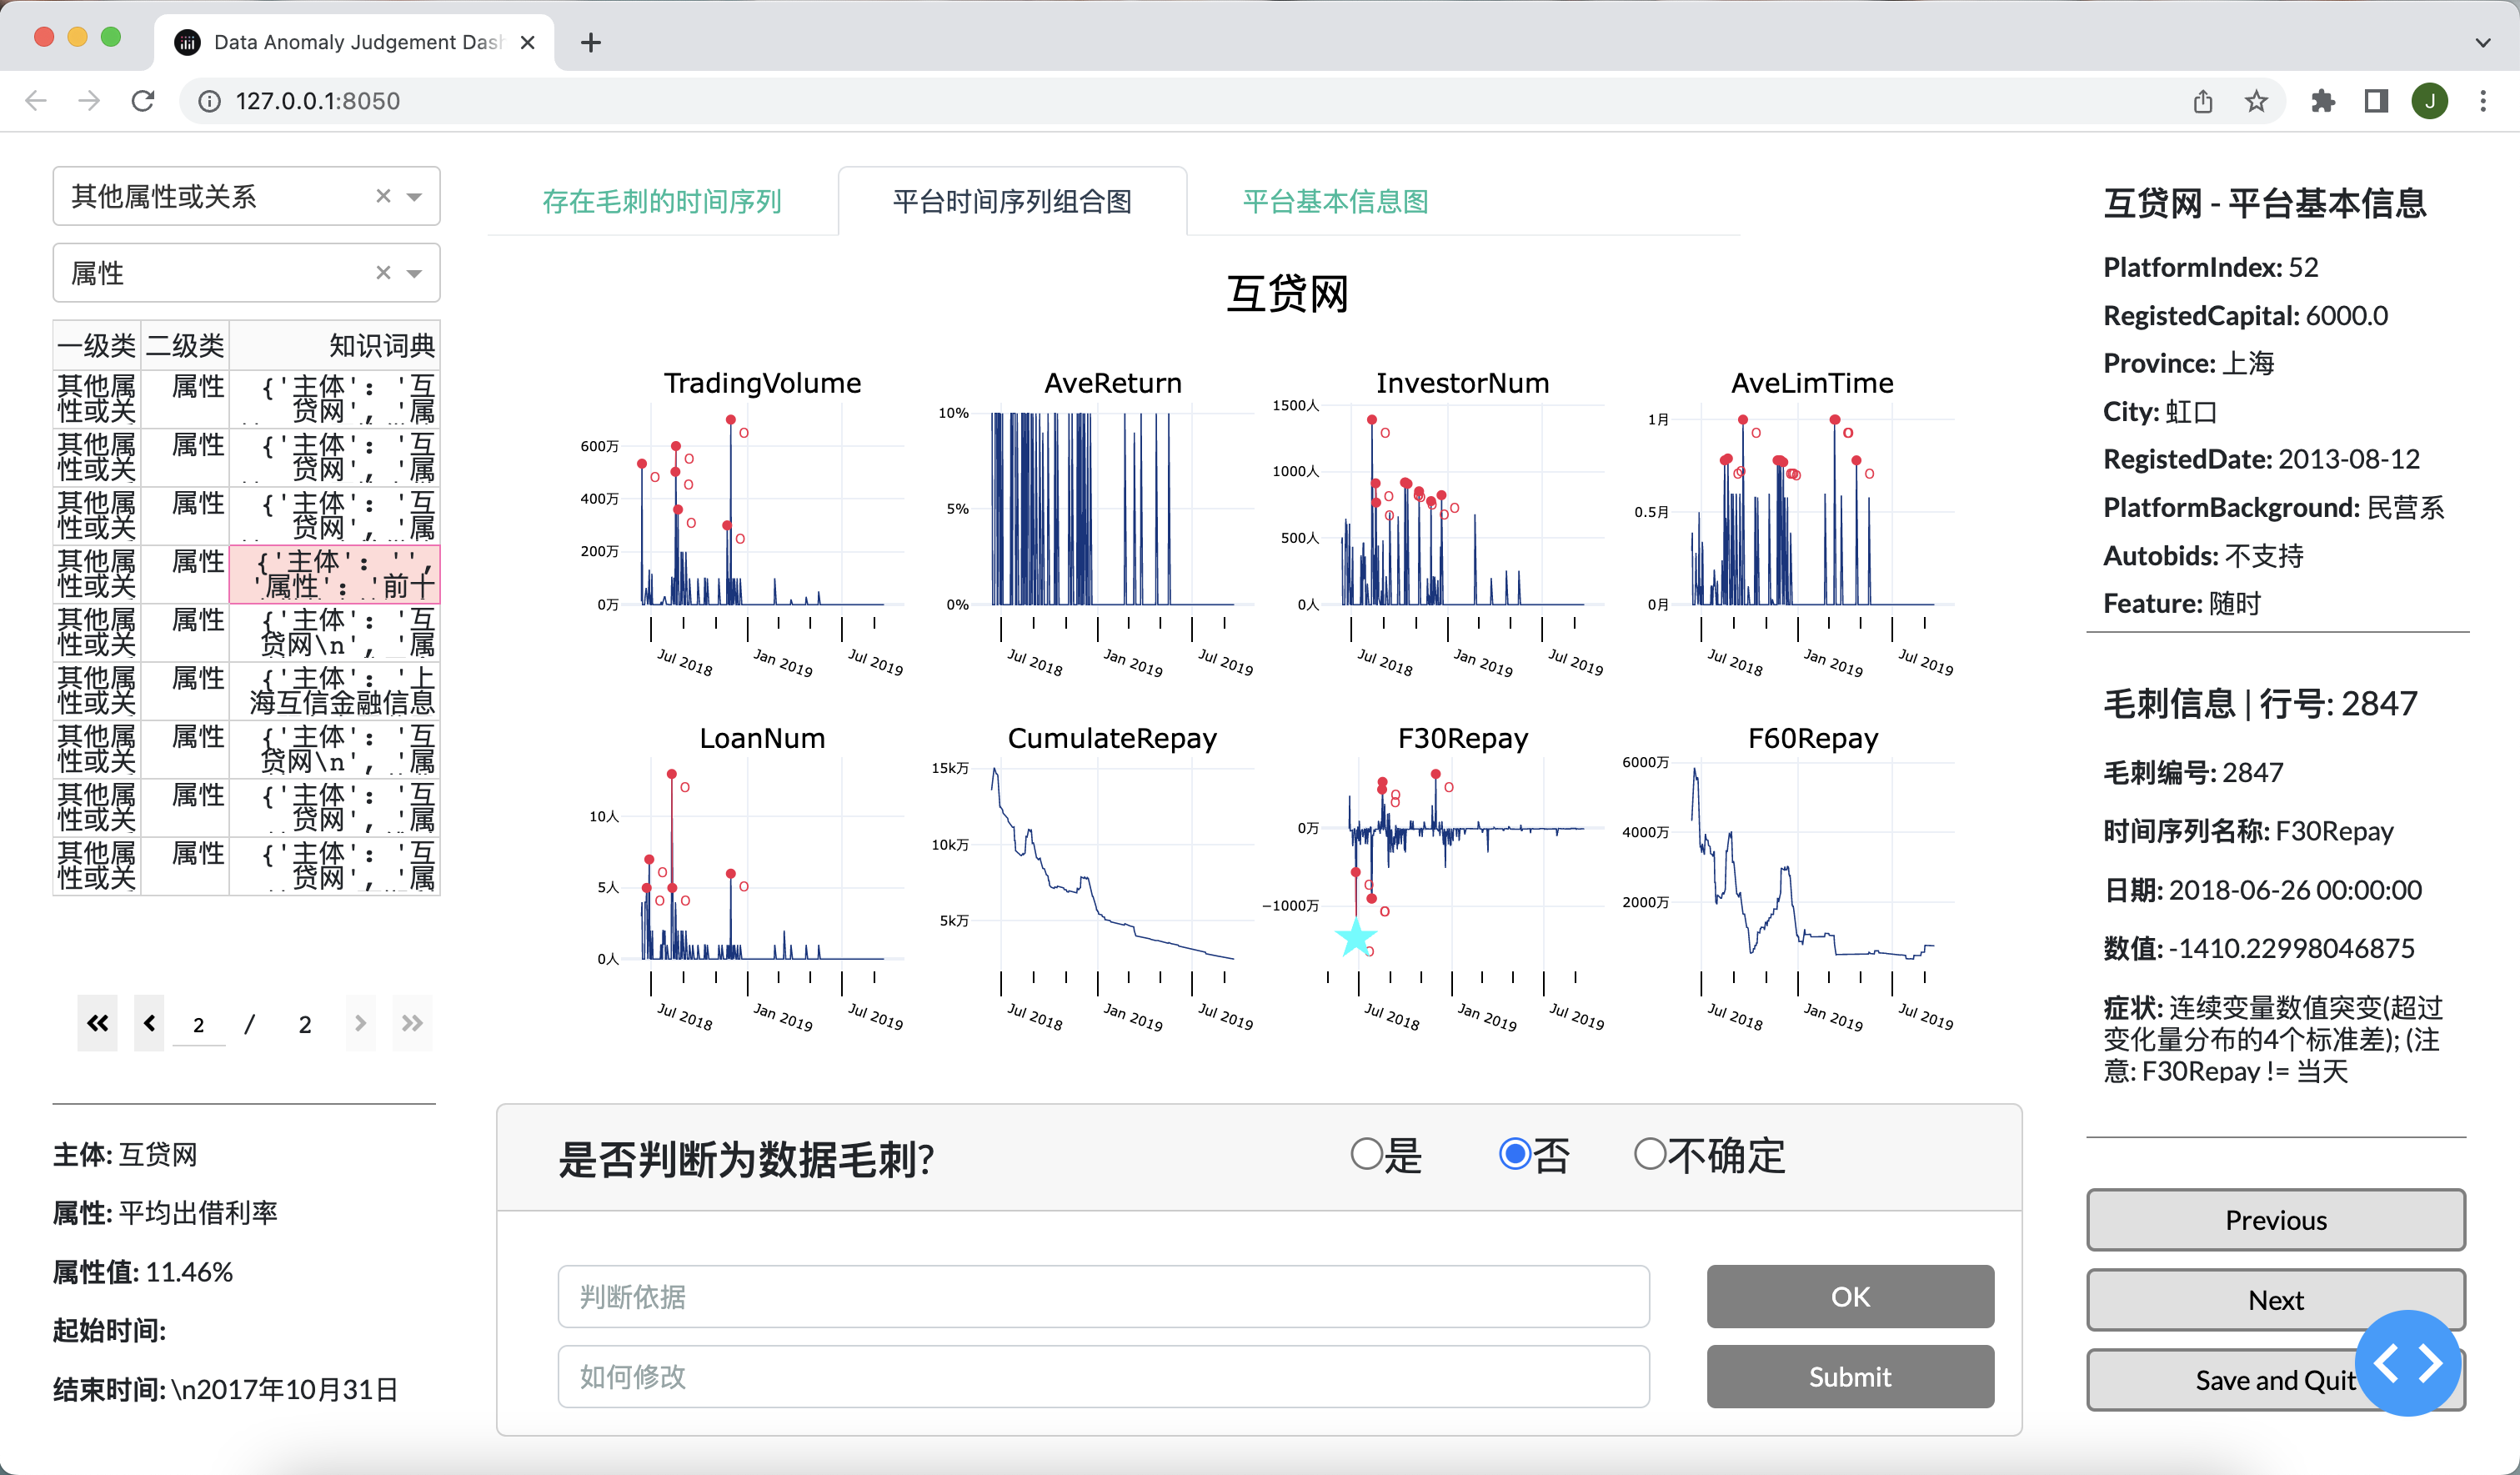
Combined plot containing subplots of times series for all features
-
Datatable showing all the relevant knowledge point for the p2p lending platform, with filter options for "first-class" and "second-class"
-
Text area showing relevant information about the suspected anomaly point and the basic information about the p2p lending platform in which the data anomaly is reported
- Run the script
app.py. - Wait for the link to appear in the console
- Go to the given link using a internet browser

- Click the "save and quit" button on the webpage
- Click "confirm" on the poped up window
- Close the webpage
- Enter
Ctrl+Cin the terminal that the server is running

- Interactive time series plot with slidable plotting window
- Interactive combination plot with multiple time series
- Basic infomation plot for peer-to-peer lending platforms