Add performance profiling infrastructure - #427
Conversation

|
Action items:
|
|
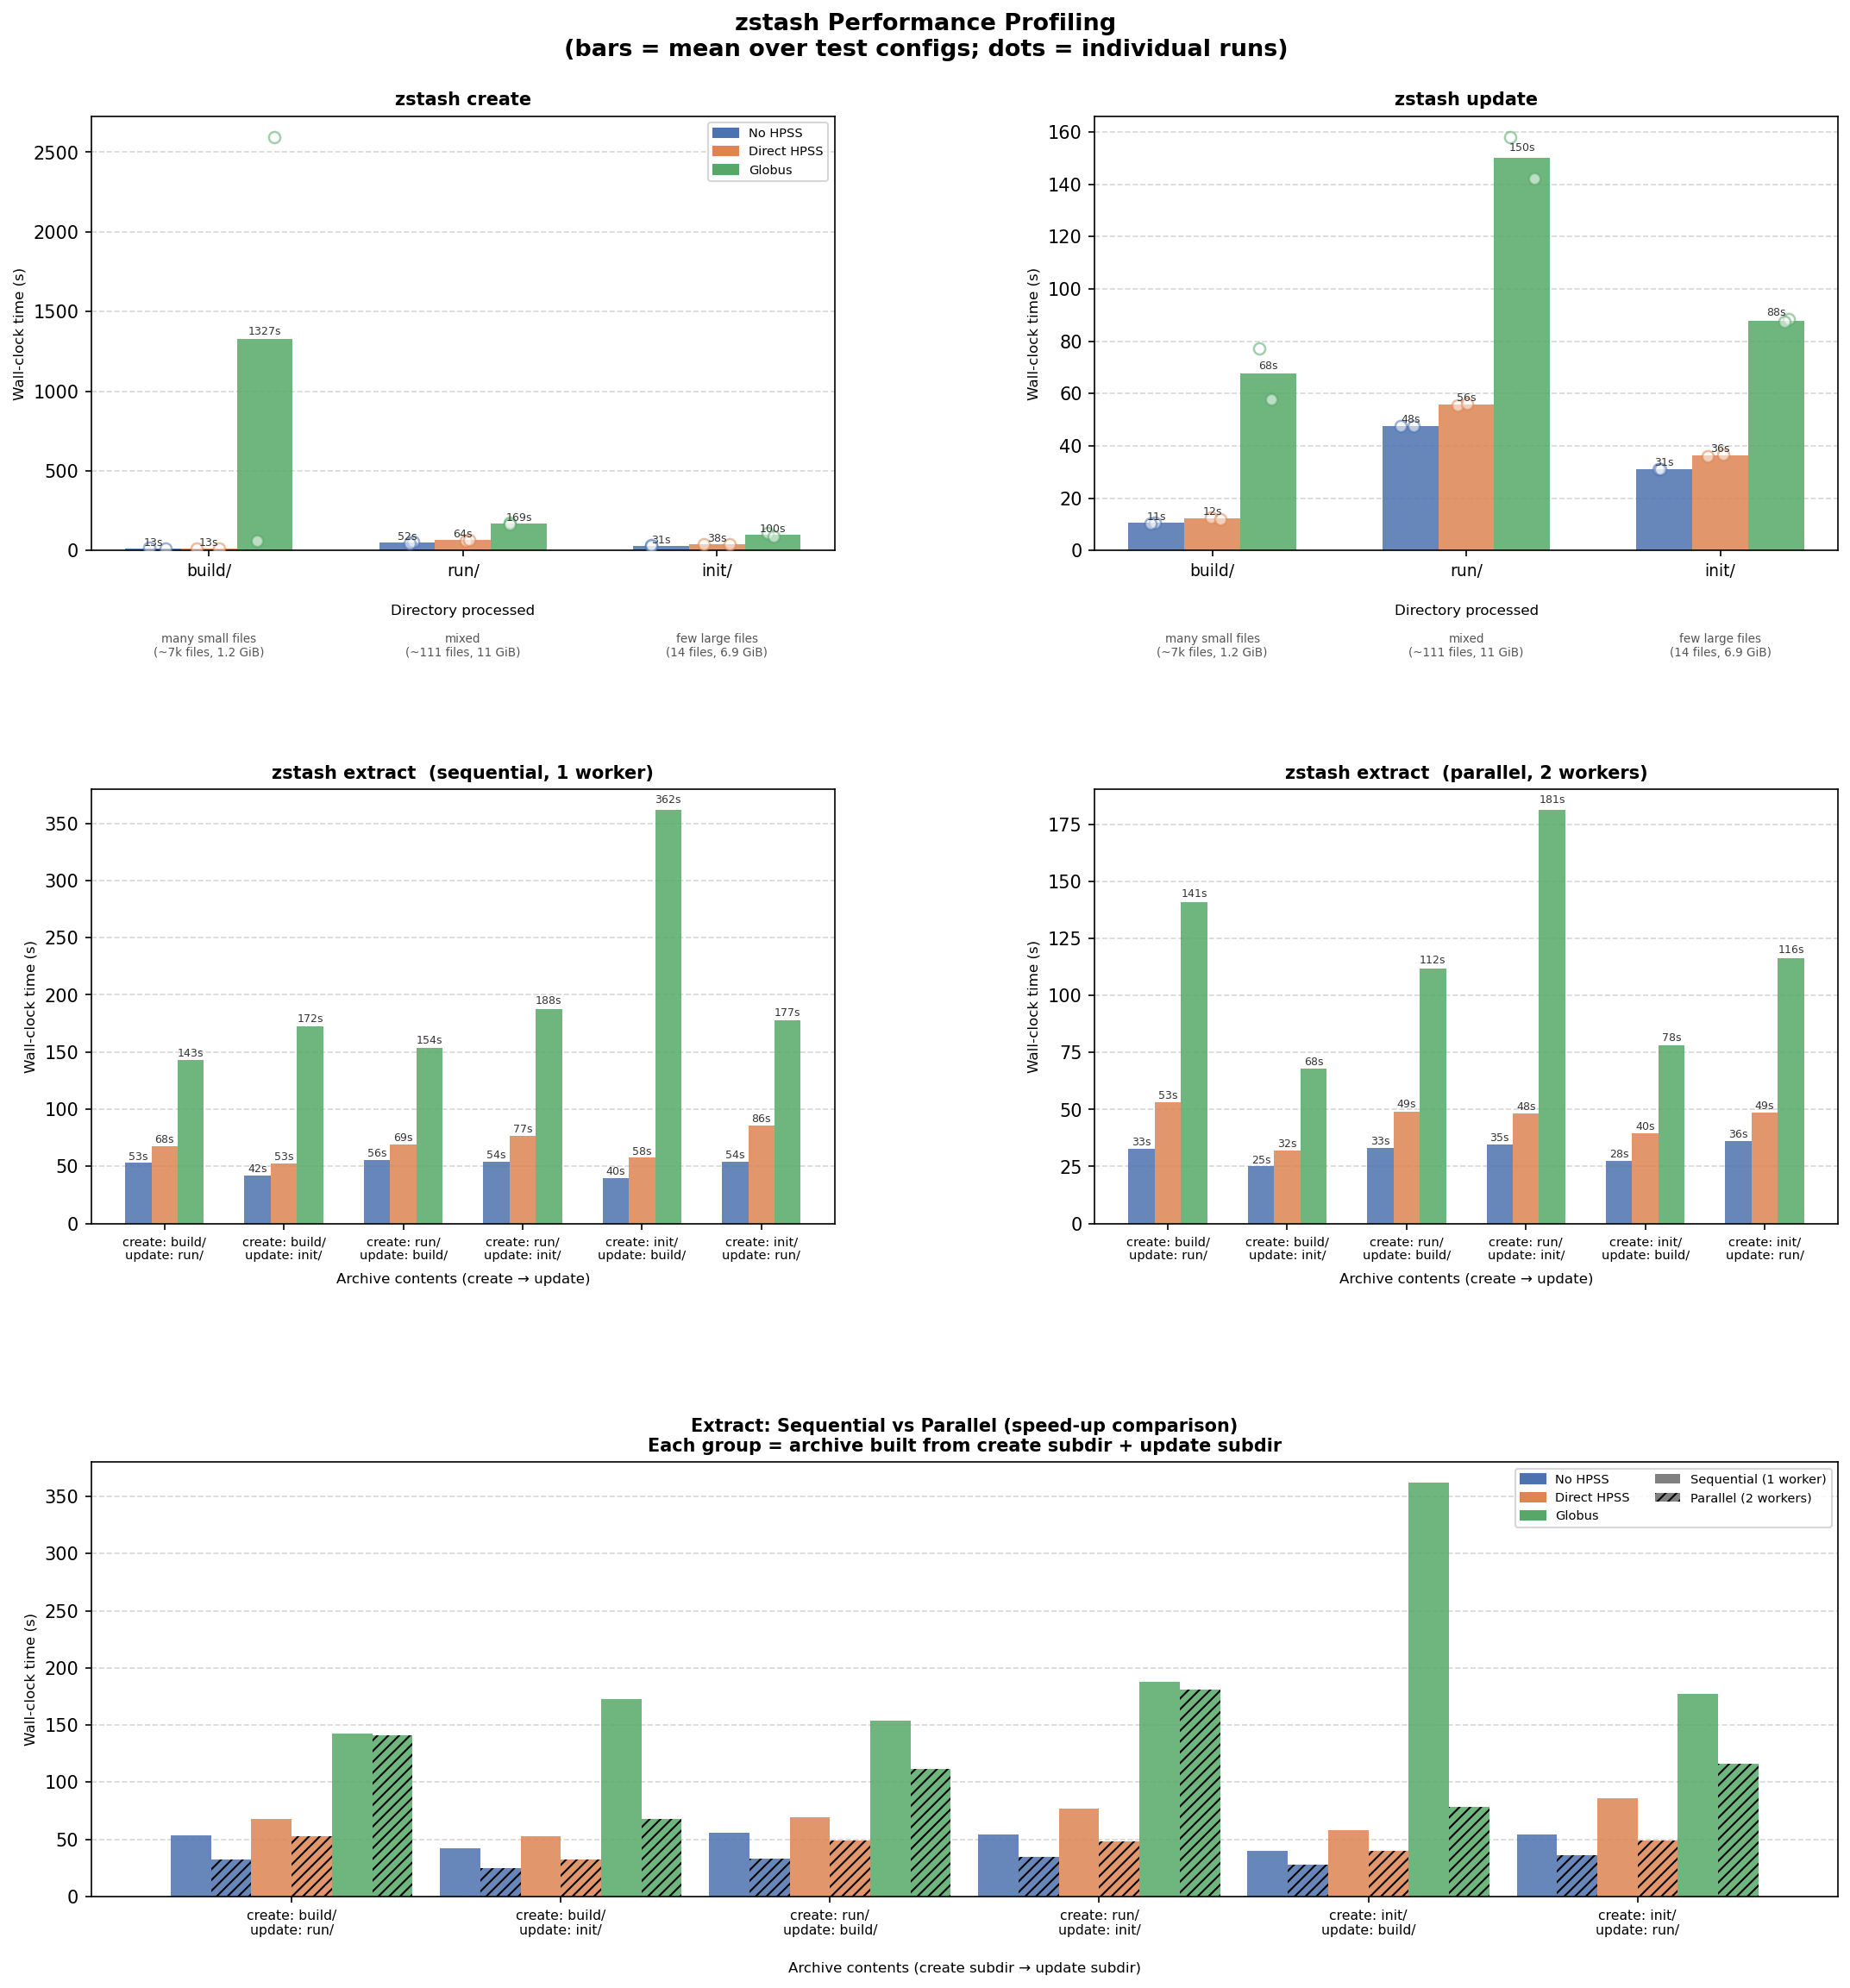
Results from running on 2026-04-02: 
Notes:
Setupcd ~/ez/zstash
git status
# On branch force-fork-parallel
# nothing to commit, working tree clean
git checkout add-performance-profiling
git log --oneline | head -n 10
# 9d6d15f Fixes made comparing pr402 and pr424
# a6cbc12 Update parameters
# 7467b68 Improve plots
# def78ac Fixes to generate plots
# ee61184 Add ability to configure hpss options
# c3ead41 Add regression testing
# 8662955 Send output to web server
# 8c3c555 Apply changes from Claude
# ee2dda7 Add performance profiling as a standard zstash test
# c14b8ee Add AGENTS.md (#423)
# Good, matches https://github.com/E3SM-Project/zstash/pull/427/commits
nersc_conda
rm -rf build
conda clean --all --y
conda env create -f conda/dev.yml -n zstash-pr427-performance-profile-20260402
conda activate zstash-pr427-performance-profile-20260402
pre-commit run --all-files
python -m pip install .
cd tests/performance
emacs generate_performance_data.bash # Edit parameters
git diff # Check diff
./generate_performance_data.bash
# ~2-3 hours to run, note there is the manual step to paste an auth code
# [SUCCESS] All tests completed. Results saved to: /pscratch/sd/f/forsyth/zstash_performance/performance_20260402/results.csv
# [INFO] Now edit IO paths and run: python visualize_performance.py
emacs visualize_performance.py # Edit parameters
git diff # Check diff
pre-commit run --all-files
git add -A
python visualize_performance.py
# Figure 1 (overview) saved to: /global/cfs/cdirs/e3sm/www/forsyth/zstash_performance/performance__20260402_pr427.png
# Accessible at: https://portal.nersc.gov/cfs/e3sm/forsyth/zstash_performance/performance__20260402_pr427.png |

2a3d7dc to
1cb3eb8
Compare
|
Rebased off the latest Latest commit 1cb3eb8 is Claude's resolution of:
For reference, previous plots:
Remaining action items:
|
Setupnersc_conda # Activate conda
rm -rf build
conda clean --all --y
conda env create -f conda/dev.yml -n zstash-pr427-20260603
conda activate zstash-pr427-20260603
pre-commit run --all-files
# Make changes to tests/performance/visualize_performance.py
python -m pip install .
cd tests/performance/
python visualize_performance.py
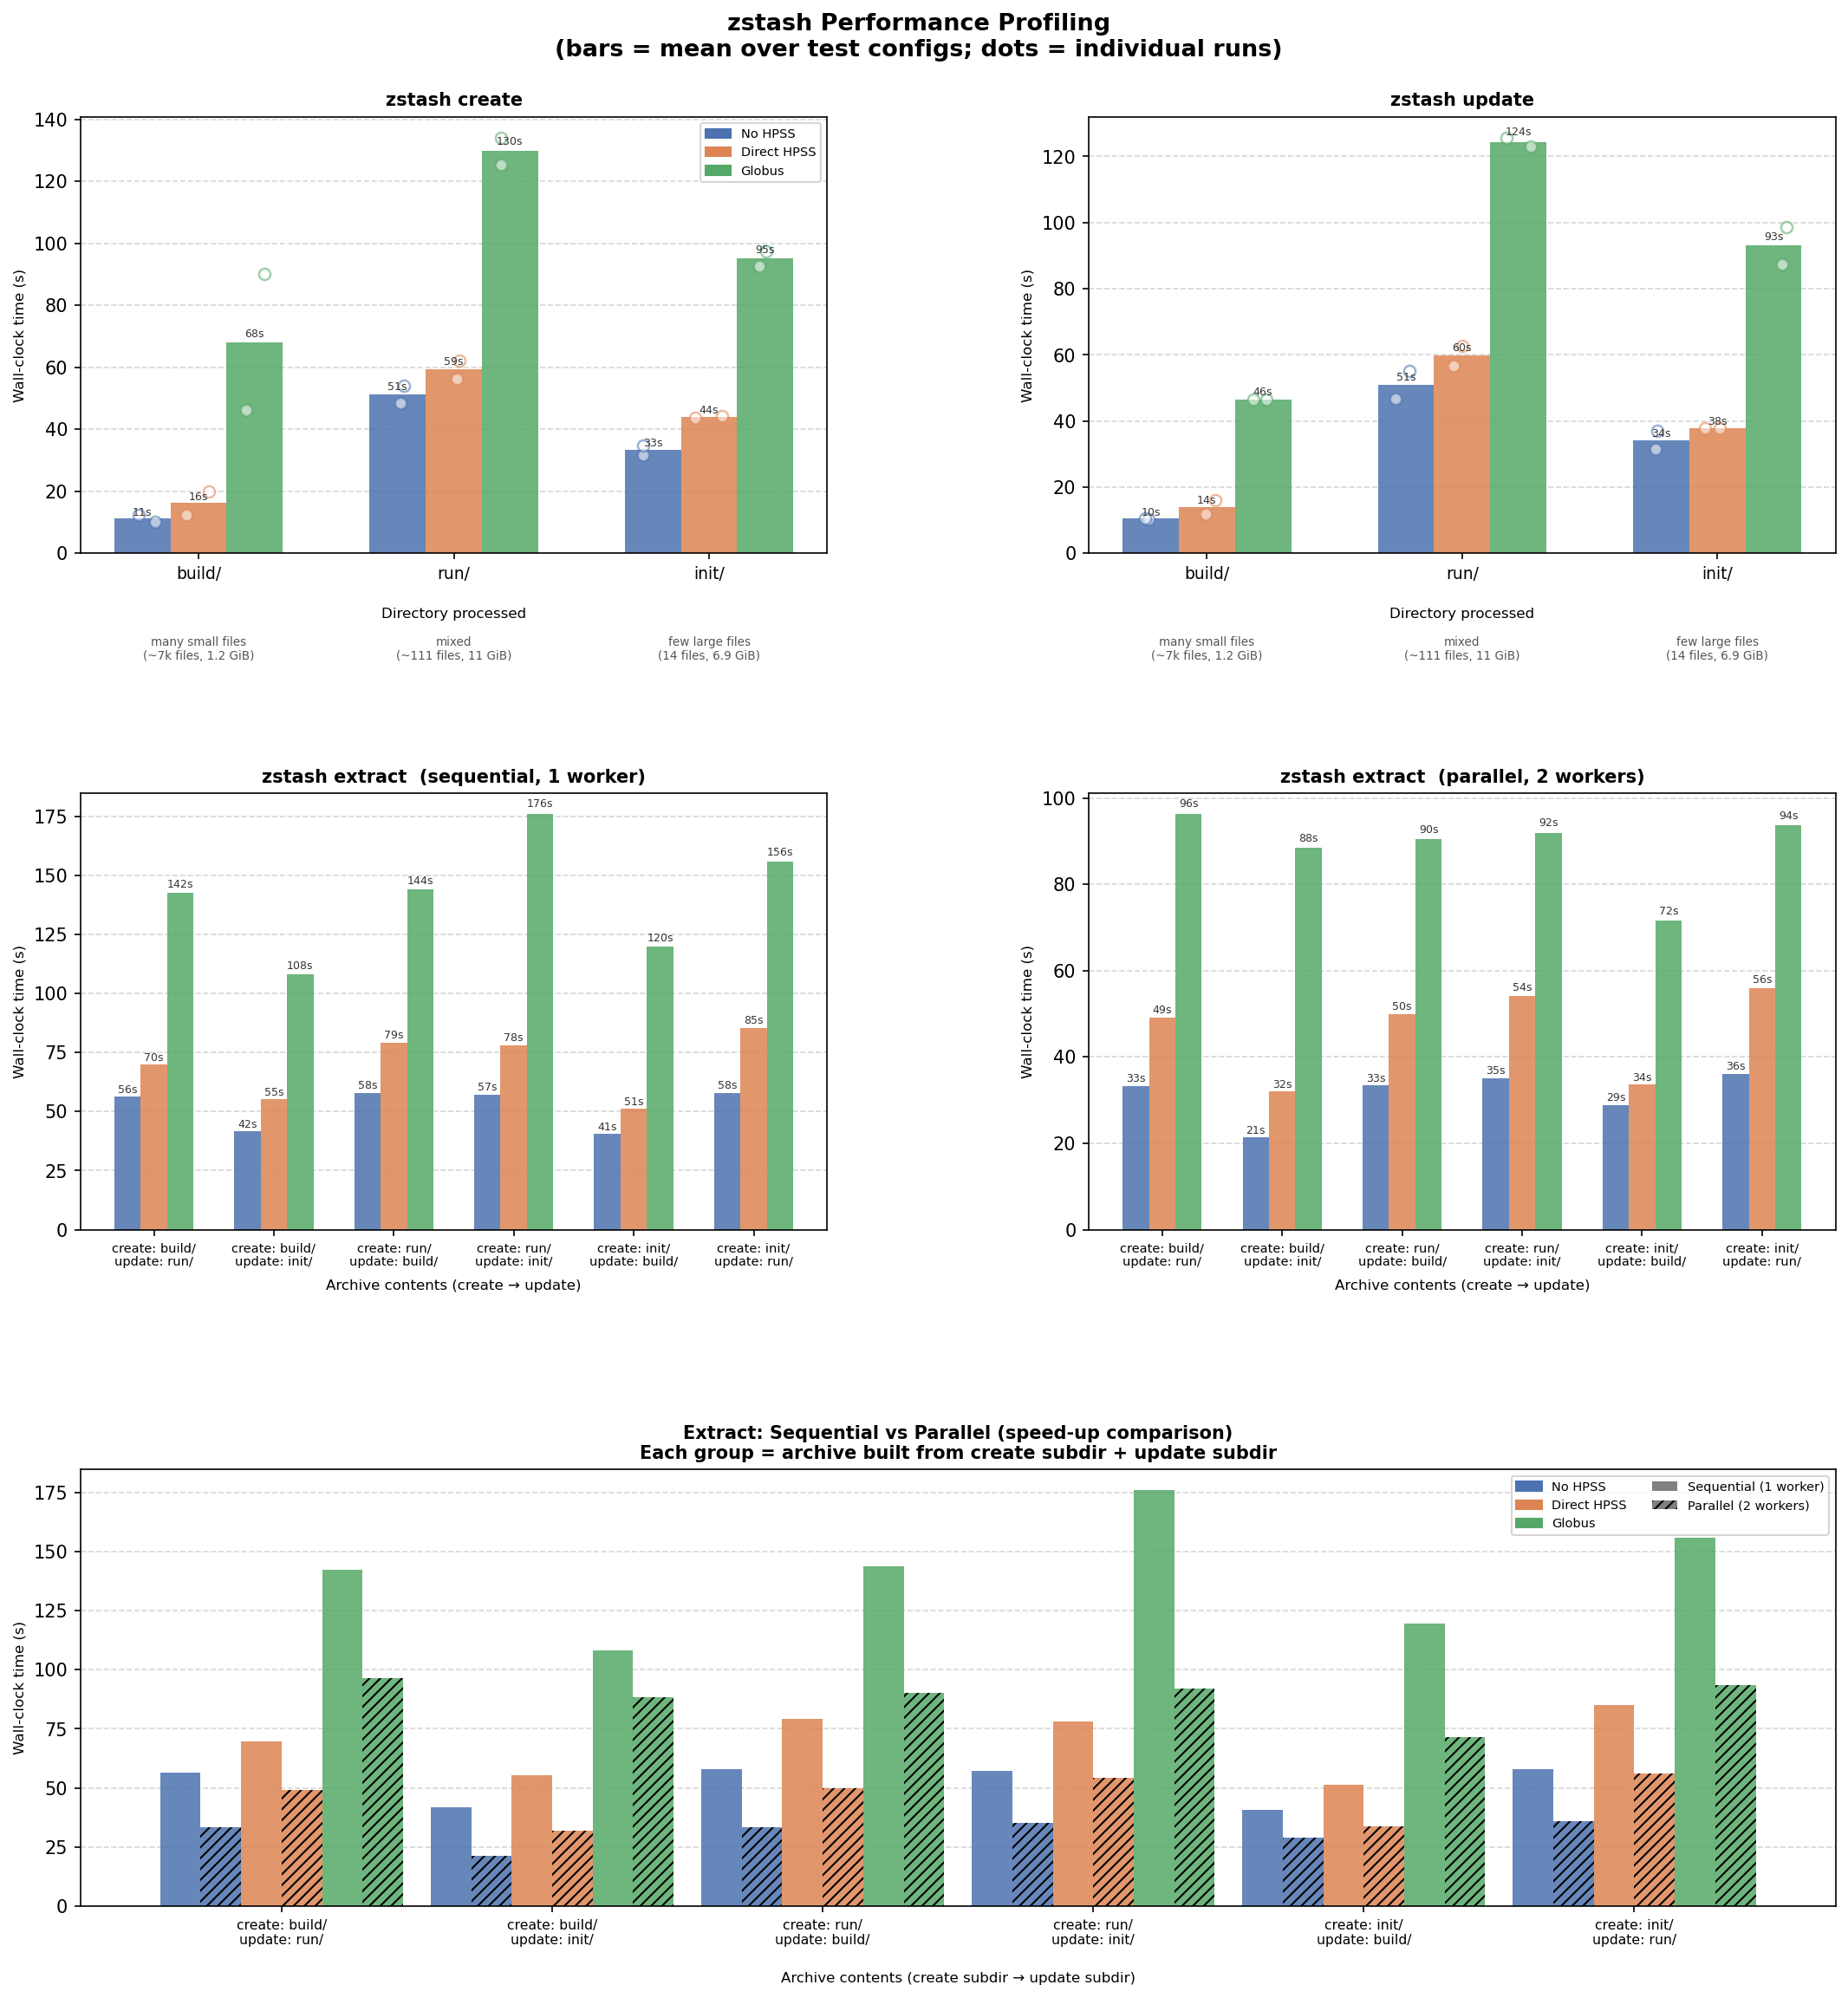
# Figure 1 (overview) saved to: /global/cfs/cdirs/e3sm/www/forsyth/zstash_performance/performance_pr427_20260603.png
# Accessible at: https://portal.nersc.gov/cfs/e3sm/forsyth/zstash_performance/performance_pr427_20260603.png
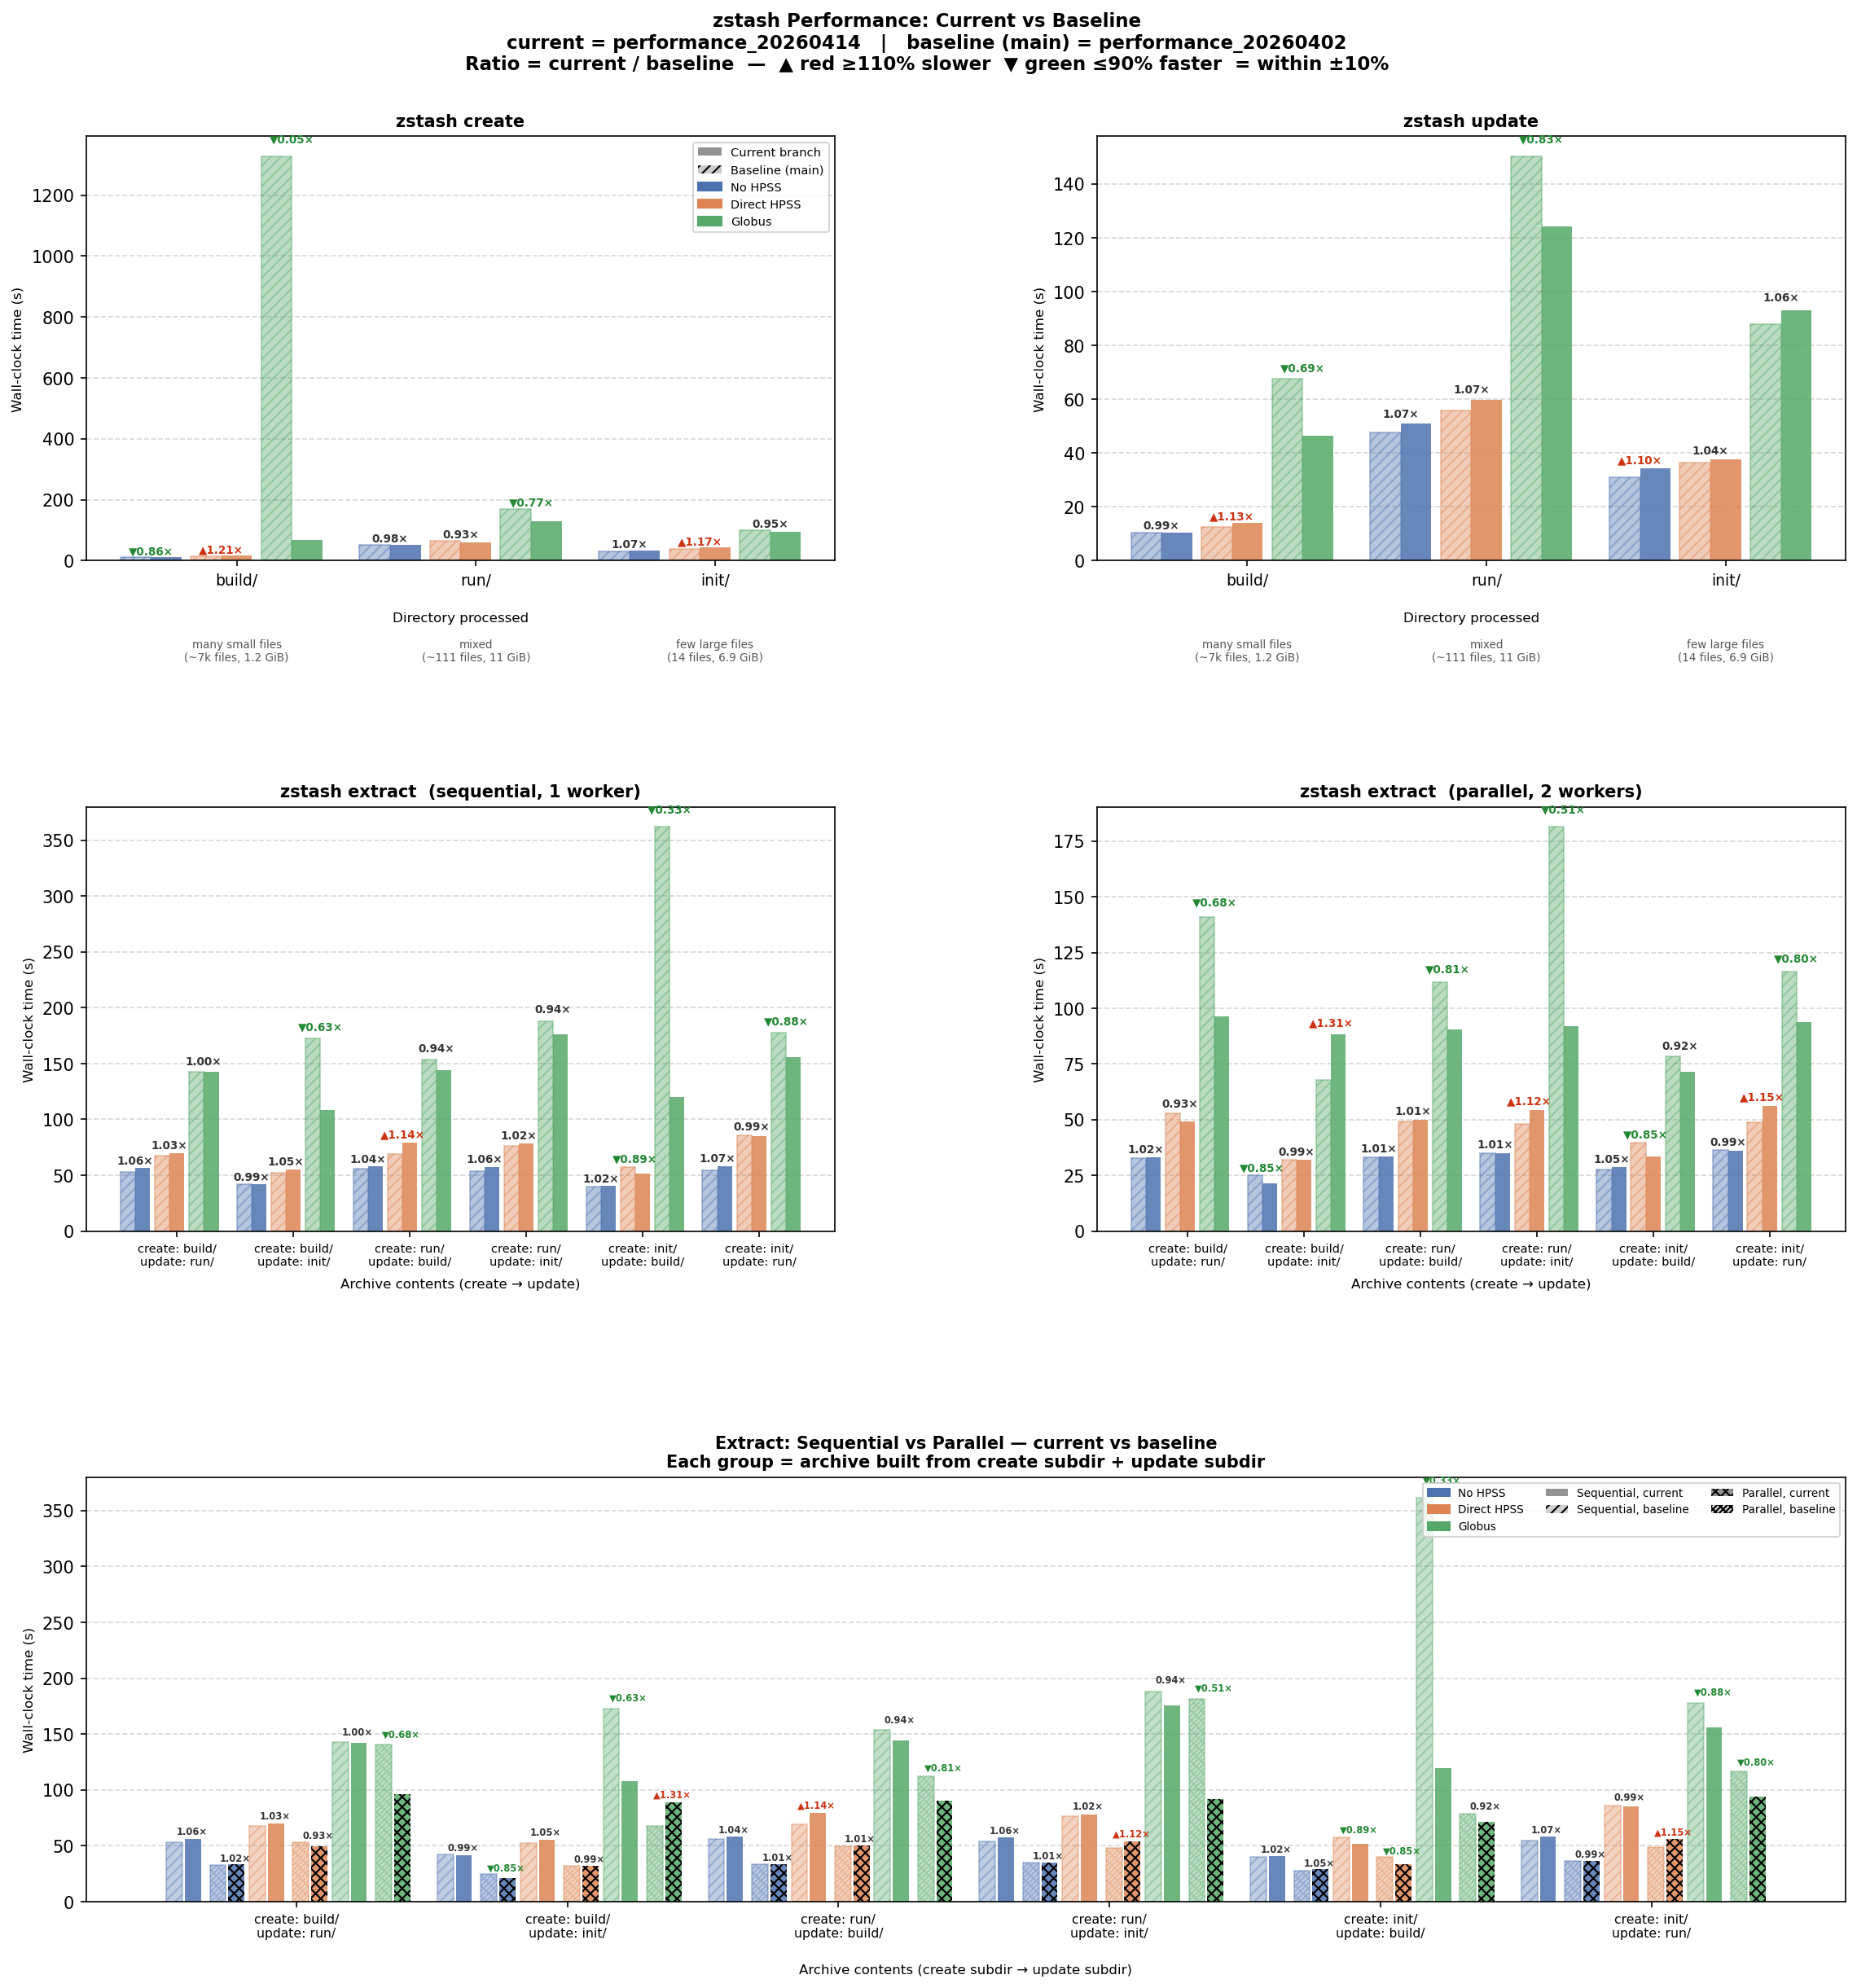
# Figure 2 (baseline comparison) saved to: /global/cfs/cdirs/e3sm/www/forsyth/zstash_performance/performance_pr427_20260603_vs_baseline.png
# Accessible at: https://portal.nersc.gov/cfs/e3sm/forsyth/zstash_performance/performance_pr427_20260603_vs_baseline.pngFig1: https://portal.nersc.gov/cfs/e3sm/forsyth/zstash_performance/performance_pr427_20260603.png 

✅ "baseline" bars are now to to the left of the "current" bars |

|
@forsyth2 would it possible to do the performance profiling for |
There was a problem hiding this comment.
Pull request overview
Adds a new, documented performance profiling workflow under tests/performance/ to
measure and visualize zstash runtime across operation modes and HPSS settings,
and updates the dev Conda environment to support the visualization tooling.
Changes:
- Add a Perlmutter-oriented performance data generation script that records
zstash create/update/extractruntimes into a CSV. - Add a Python visualization script to plot performance results and optionally
compare against a baseline run. - Document the performance profiling workflow and link it from the main tests
README; add plotting/data dependencies to the dev Conda environment.
Reviewed changes
Copilot reviewed 5 out of 5 changed files in this pull request and generated 8 comments.
Show a summary per file
| File | Description |
|---|---|
tests/README.md |
Adds a pointer to the new performance profiling docs. |
tests/performance/README.md |
Documents how to generate and visualize performance CSVs. |
tests/performance/generate_performance_data.bash |
Generates performance CSV by running a matrix of zstash operations/modes. |
tests/performance/visualize_performance.py |
Plots performance results and optional current-vs-baseline comparisons. |
conda/dev.yml |
Adds matplotlib-base, pandas, and numpy to support visualization. |
💡 Add Copilot custom instructions for smarter, more guided reviews. Learn how to get started.
I'm assuming you mean new/recent reports? I know we resolved the high-res team's issues by making more use of the
I think that's good idea, but can we do it as a separate pull request? I think this PR is pretty close to merging, and I'd like to have something on For what it's worth, Claude's assessment: Looking at the code, adding Arguments for a separate PR:
Arguments for doing it now:
My recommendation: separate PR. The current PR is clean and self-contained. |

| # This version of perf.cfg has filled-in username paths. | ||
|
|
||
| performance_archive_dir=/global/homes/f/forsyth/zstash_performance_records | ||
|
|
||
| results_csv=/pscratch/sd/f/forsyth/zstash_performance/performance_20260603/results.csv | ||
| baseline_results_csv=/pscratch/sd/f/forsyth/zstash_performance/performance_20260414/results.csv | ||
| output_path=/global/cfs/cdirs/e3sm/www/forsyth/zstash_performance/performance_pr427_20260603.png | ||
|
|
||
| viz_run_id=viz_test_20260618_try2 | ||
| most_recent_gen_run_id=performance_20260603 | ||
|
|
||
| hpss_filter=none,hpss,globus | ||
|
|
||
| figures= |
There was a problem hiding this comment.
This is specifically for me to have a ready-to-go cfg. The blank slate cfg is perf.cfg.
forsyth2
changed the title

 forsyth2
left a comment
forsyth2
left a comment
forsyth2
left a comment
There was a problem hiding this comment.
High-level visual inspection looks fine to me. As noted in the previous comment, the latest plots also look alright and #450 will remain open to add similar performance profiling for zstash check.
Note that nothing in this PR is user facing (i.e., it's for developers only).
This should be good to merge.


Description
This PR introduces a self-contained performance profiling workflow for zstash, intended to be run on Perlmutter.
What's added
conda/perf.yml— a new conda environment (zstash_perf) that bundles the standard dev dependencies plusmatplotlib,pandas, andnumpyfor performance visualization.tests/performance/README.md— full setup and usage guide covering how to generate performance data (viagenerate_performance_data.bash) and visualize results (viavisualize_performance.py), including config file templates and Perlmutter path conventions.tests/performance/visualize/visualize_performance.py— a matplotlib-based script that produces up to four figures: an overview of the current run, a baseline comparison, and two archive-level figures (create/update and extract). Supports config-driven filtering by HPSS mode and figure selection, and outputs to either a file path or an interactive display.tests/README.mdto the new performance docs.Also fixed
conda/dev.yml(.pre-commit.config.yaml→.pre-commit-config.yaml).conda/dev.ymlto reflect the current split intobuild_workflow.ymlandrelease_workflow.yml.Notes
Performance records are currently user-specific (stored in a personal long-term directory on Perlmutter). A centralized location can be considered if more developers start running profiling regularly.
Background
#414 introduced some early performance profiling for
zstash, but these changes were not ultimately included inmain. However, performance is becoming an ever more important feature ofzstash, as that work showed. Other issues relating to performance: #402/#424, #249.Objectives:
zstashruntimes on various combinations of variables:create,update,extractextractsequential vs parallel mode (especially relevant for Add Python 3.14 support #402/Fix Python 3.14 compatibility: AbsoluteLinkError, pickling errors, config propagation, HPSS hang, and print_all_contents deadlock in extract.py and parallel.py #424)--hpssas "none", an HPSS path, or a Globus pathResolves:
Select one: This pull request is...
Small Change