A small, composable plotter for evolutionary figures. Two domains share one grammar: ph.trees
plots phylogenetic trees and ph.genomes plots genomes, synteny and alignments. Start a figure,
add layers with +, and save it to SVG, PDF, or PNG.
pip install git+https://github.com/AADavin/PhylustratorSVG output needs nothing else; for PDF/PNG also install cairosvg (pip install cairosvg).
import phylustrator as ph

tree = ph.trees.loads("((((Human:6,Chimp:6)a:2,Gorilla:8)b:3,Orang:11)c:5,Gibbon:16)root;")
brain = {"Human": 1350, "Chimp": 400, "Gorilla": 500, "Orang": 400, "Gibbon": 100,
         "a": 650, "b": 560, "c": 500, "root": 470}

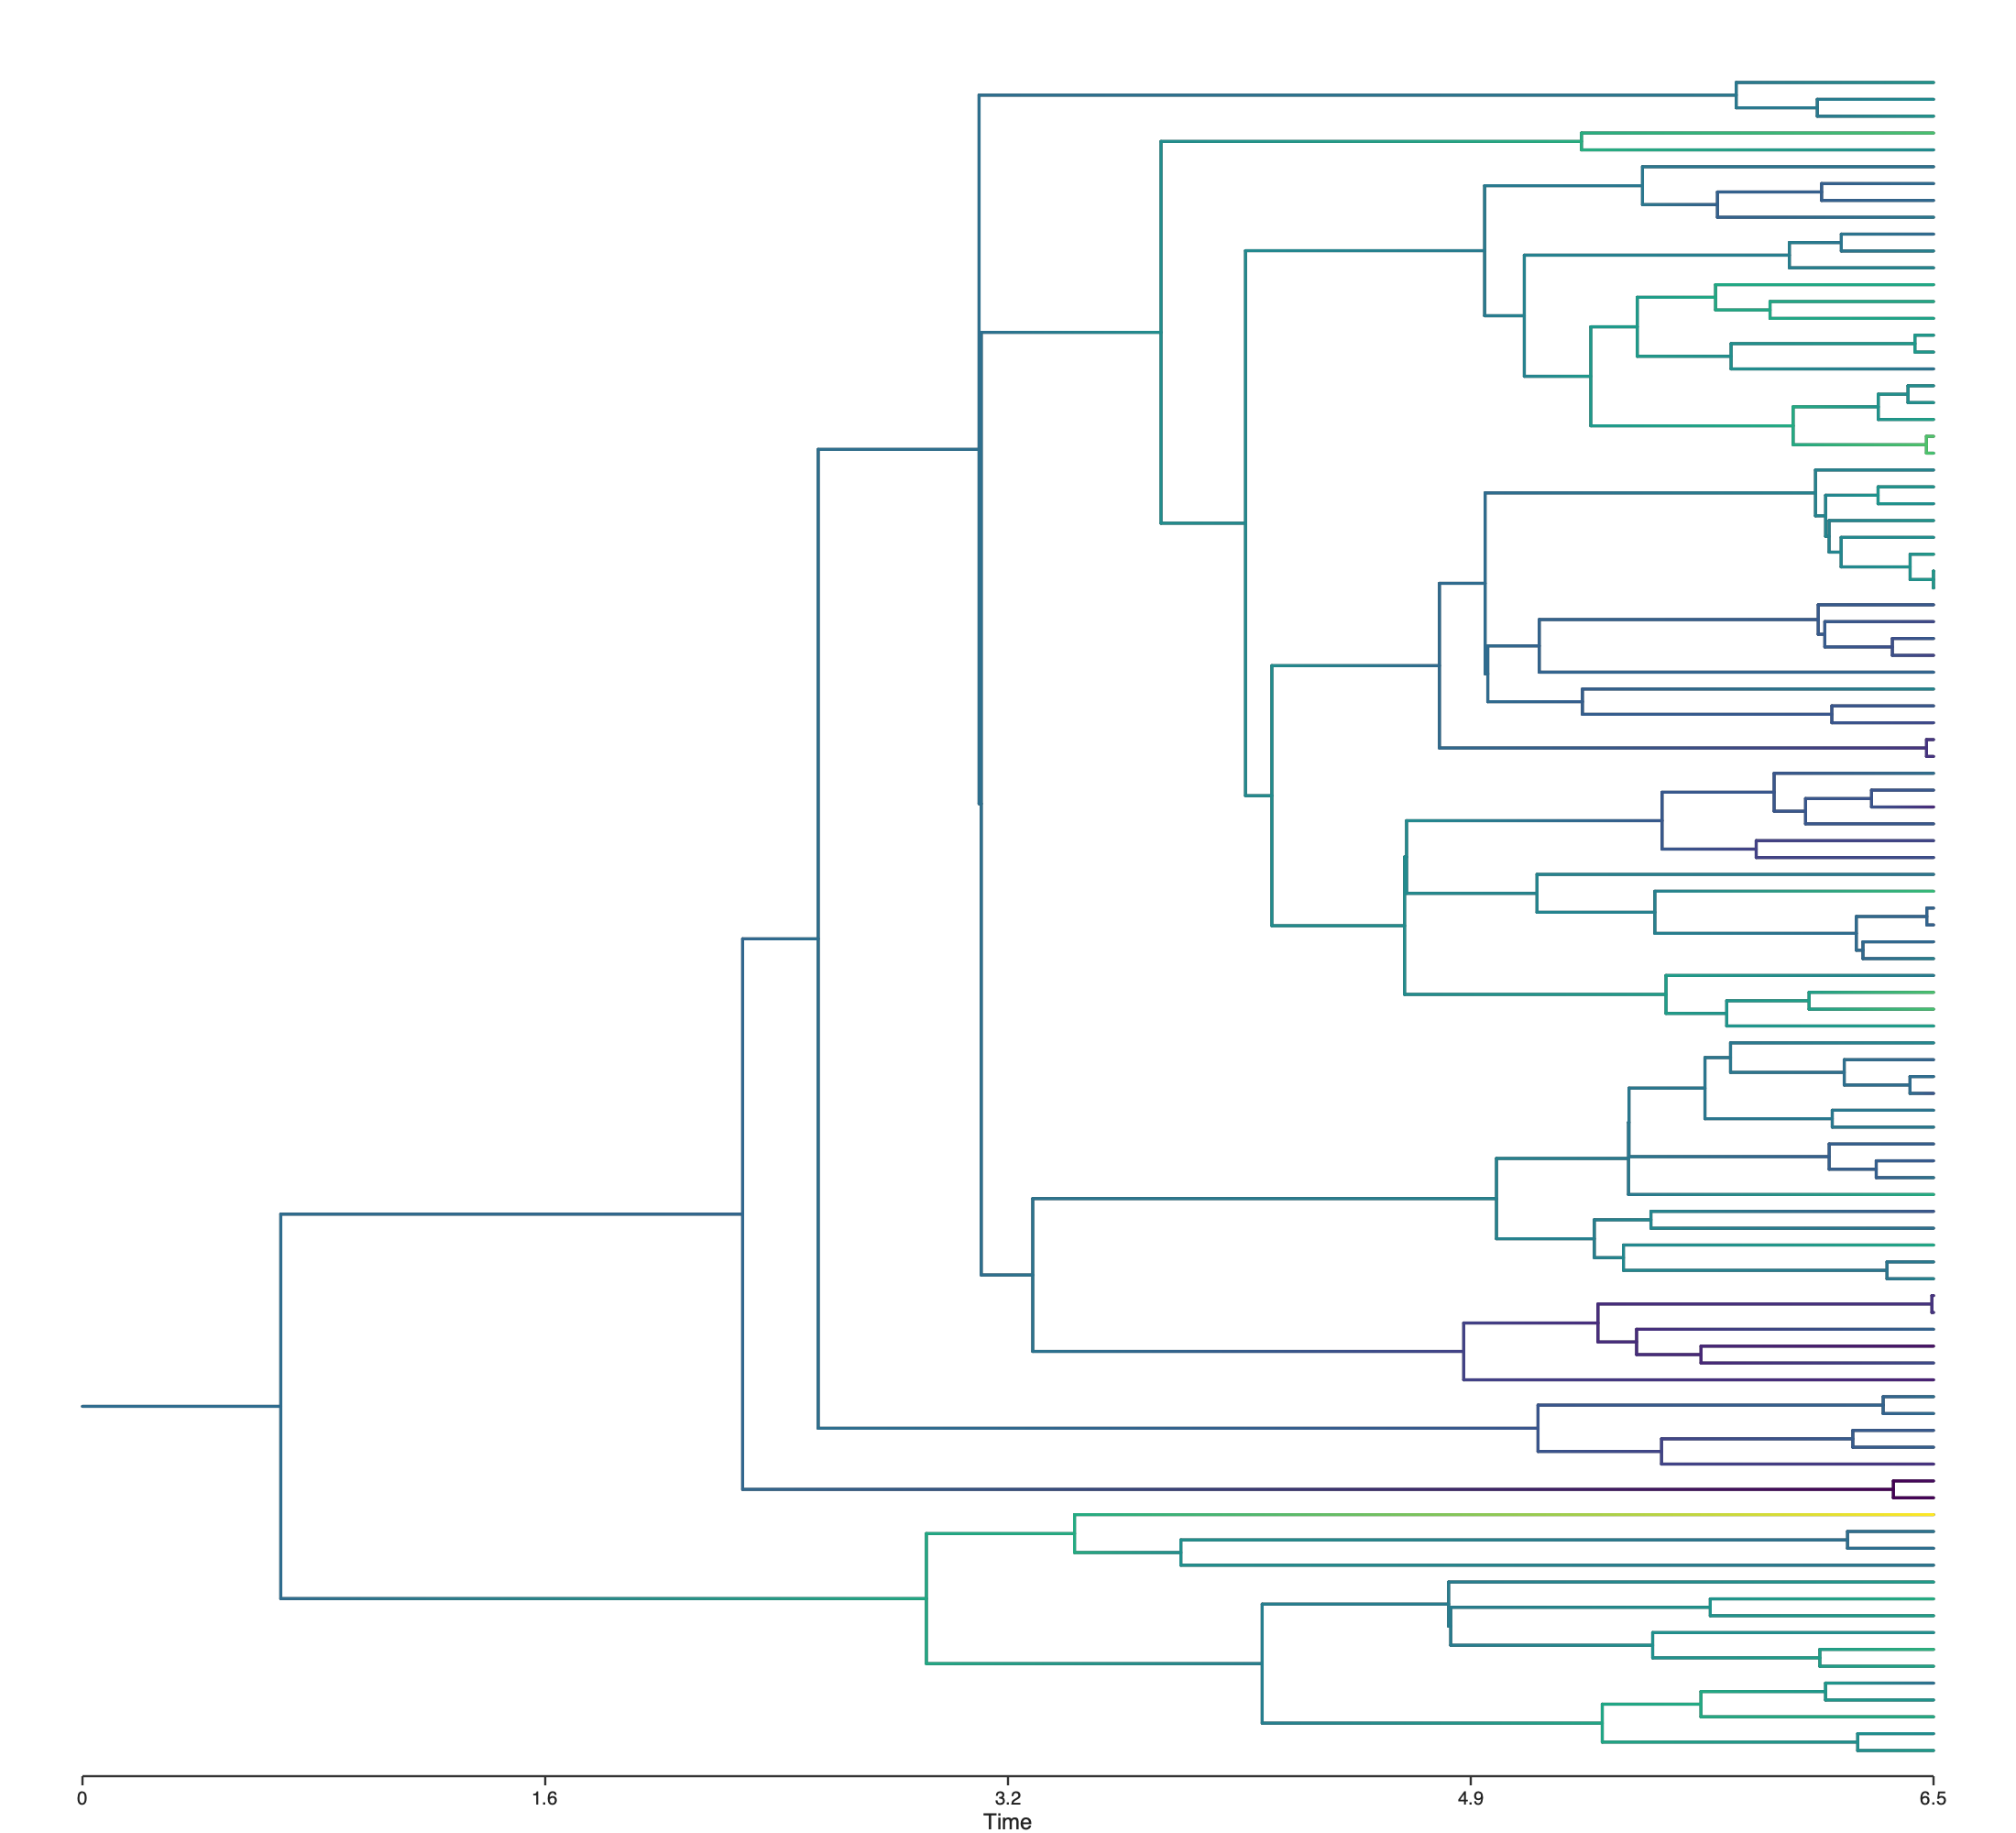
(ph.trees.plot(tree)
 + ph.trees.color_branches(brain)
 + ph.trees.tip_labels()
 + ph.trees.colorbar("brain size (cc)")
 + ph.trees.time_axis("million years")).save("tree.png")
That is the whole idea: plot(tree) starts a figure and each + layer adds one decoration.
- Layouts —
rectangular(default),radial,unrooted. - Layers —
color_branches,color_history,tip_labels,node_labels,tip_track,branch_events,colorbar,legend,time_axis,time_marker,scale_bar,note,highlight_clade.
The same grammar, for genome maps. Plot a genome as a line or a ring, colour genes by family or strand, link two genomes with synteny ribbons, or set a copy-number heatmap / alignment beside a tree.
import phylustrator as ph

G = ph.genomes.read_gff("genome.gff")           # {name: Genome}
genome = next(iter(G.values()))
(ph.genomes.plot(genome, layout="circular", coordinates="nucleotide")
 + ph.genomes.genes(by="strand")
+ ph.genomes.position_axis()).save("ring.png")- Layouts —
linear,circular, andstack(one genome per row, for synteny). - Layers —
genes,synteny,highlight,position_axis. - Panels —
heatmap,alignment, placed next to a tree withph.beside(tree, panel).
ph.zombi reads the output of the ZOMBI2 genome-evolution
simulator into the data models above — kept in one clearly-separated layer so the core stays
format-agnostic:
import phylustrator as ph

G = ph.zombi.read_genomes("run/genomes")        # {lineage: Genome}
M = ph.zombi.read_profiles("run")               # family x genome copy-number Matrix
aln = ph.zombi.read_alignment("run", family=0)  # Alignment keyed by genome
tree = ph.zombi.read_species_tree("run") # a Treephyl is a one-shot tree viewer — hand it a Newick file:
phyl tree.nwk                 # render to a temporary PDF and open it
phyl tree.nwk -o fig.svg      # save instead (format from the extension: .svg / .pdf / .png)
phyl tree.nwk --radial --no-labels
Flags: --layout {rectangular,radial,unrooted} (or --radial / --unrooted), --no-labels,
--node-labels, --no-stem, --no-open. Colouring and everything else live in the Python API.
Only drawsvg (plus cairosvg for PDF/PNG). No ete3, no matplotlib.
MIT — see LICENSE.