Repository navigation
Conversation


DashboardsThe Data tab is now a dashboard page rather than one fixed layout. Rebased onto
Config"data": {
"enabled": true,
"days": 7,
"layer": "country",
"homeArea": "SFO", // default for an area variable such as $home
"dashboardsFile": "dashboards.json", // optional: a JSON array of schema-1 dashboards, relative to the config dir
"defaultDashboard": "cross-border" // optional: id to open first (default: the first built-in)
}A dashboard in that file (the same shape as Export): { "schema": 1, "id": "cross-border", "title": "Cross-border traffic", "window": "24h",
"variables": [{ "name": "home", "kind": "area", "label": "Home" }],
"panels": [
{ "id": "leaving", "title": "Leaving $home", "type": "stat",
"query": { "filters": [{ "d": "origin", "n": 0, "v": ["$home"] }, { "d": "border", "n": 0, "v": ["crossed"] }] },
"layout": { "x": 0, "y": 0, "w": 3, "h": 2 } },
{ "id": "where", "title": "Where $home's traffic is heard", "type": "bar",
"query": { "filters": [{ "d": "origin", "n": 0, "v": ["$home"] }, { "d": "border", "n": 0, "v": ["crossed"] }], "x": "heard", "split": "kind" },
"layout": { "x": 3, "y": 0, "w": 9, "h": 4 } }
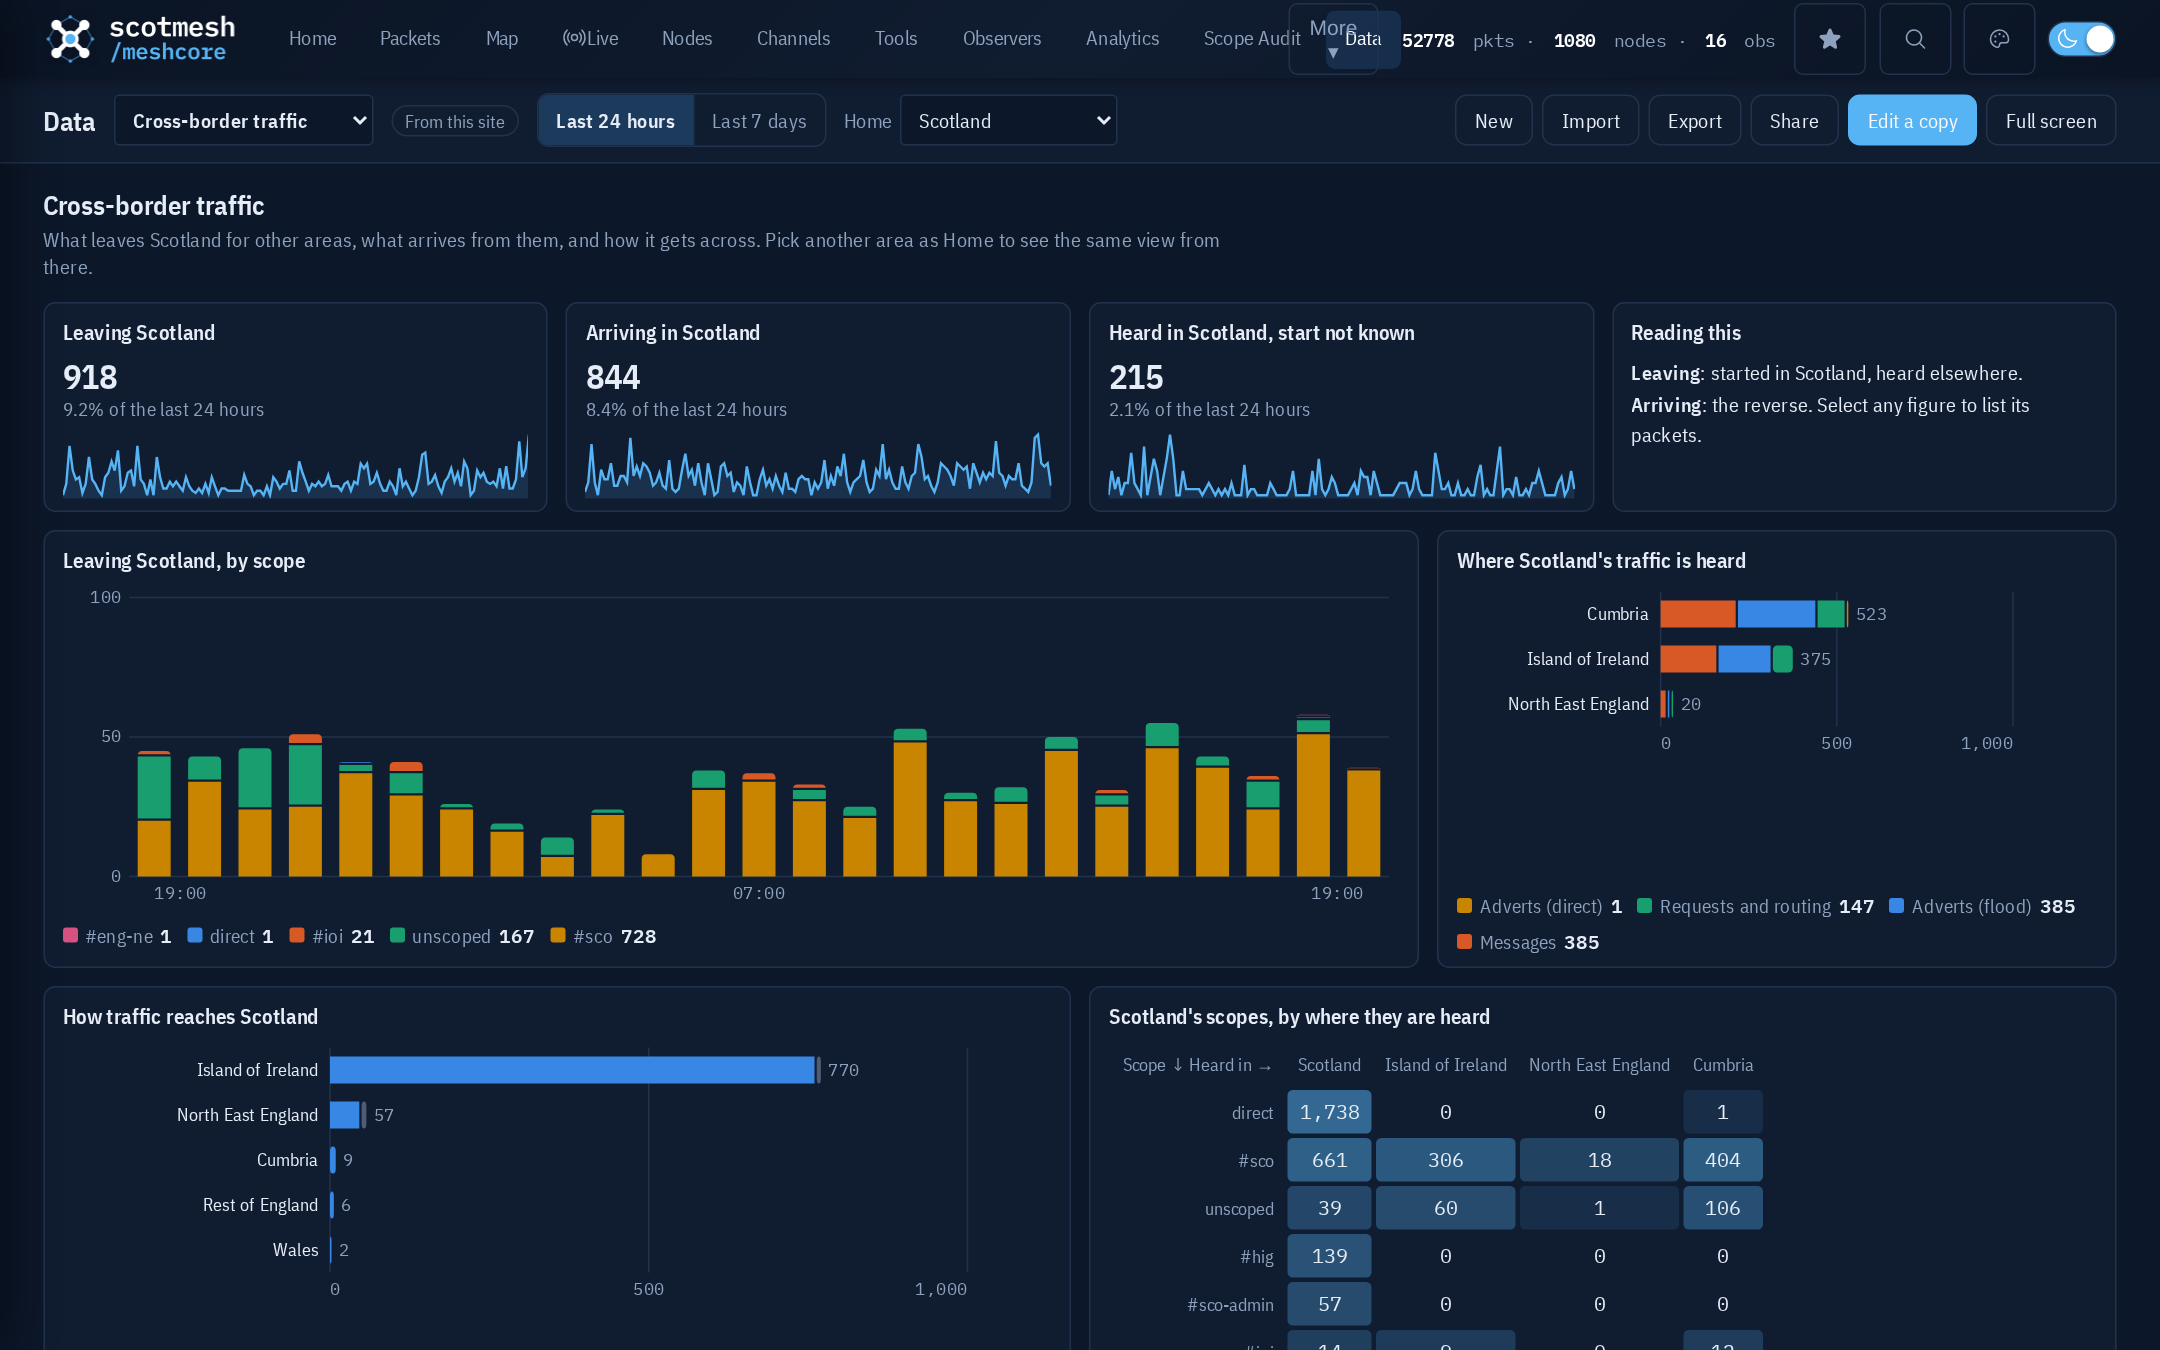
] }ScreenshotsAn operator dashboard on live data (1440 px, dark):
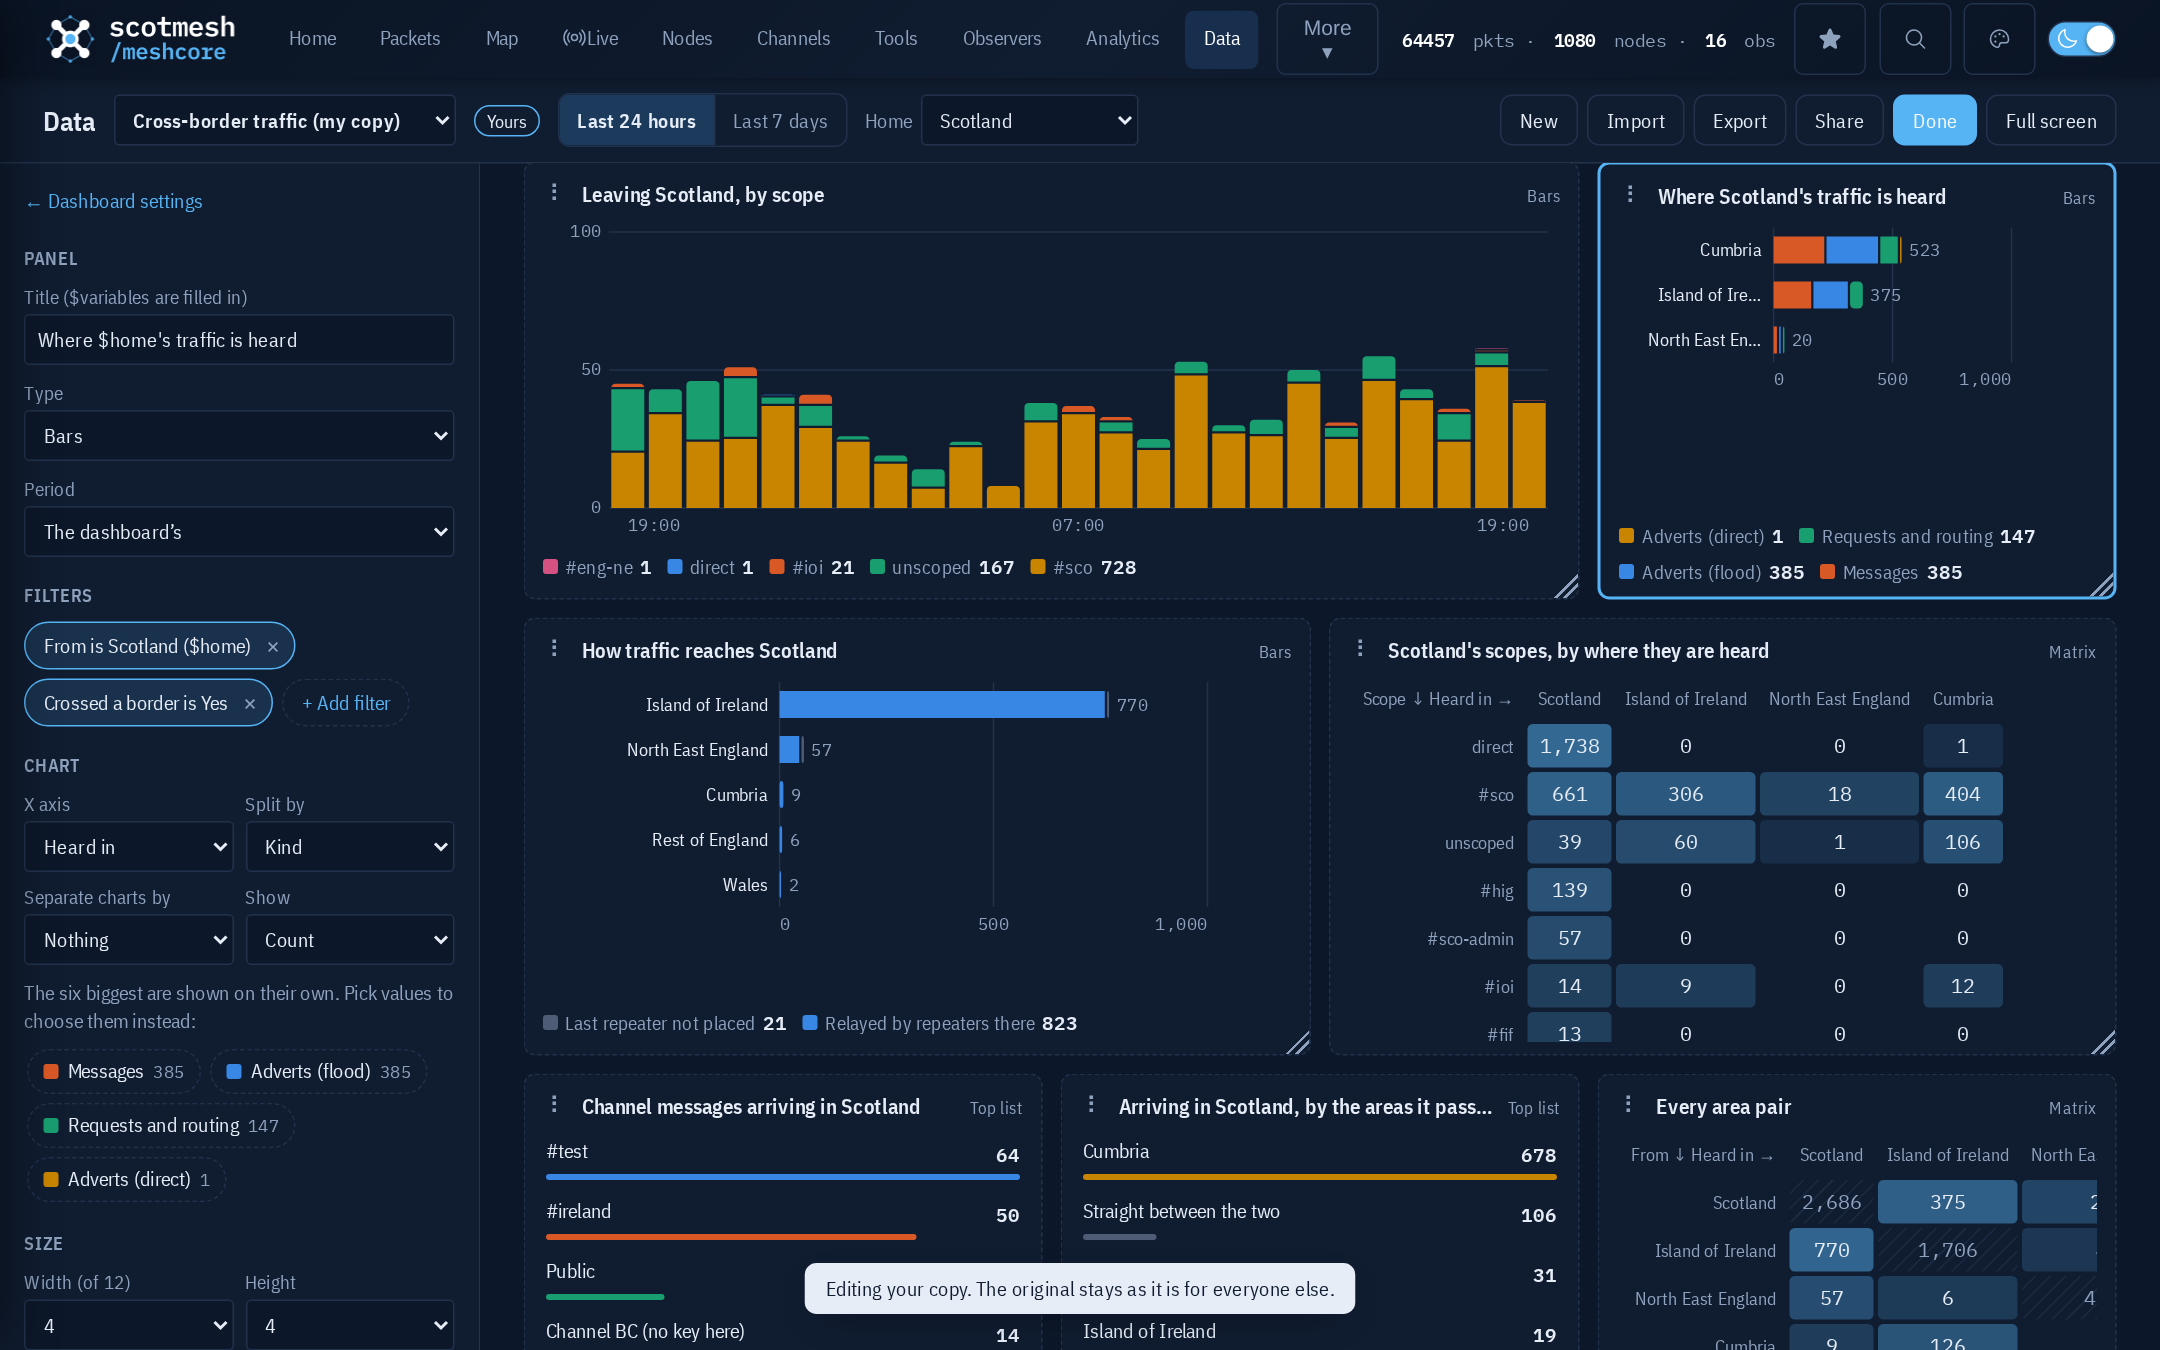
Edit mode: the rail edits the selected panel, here a copy of the operator dashboard:
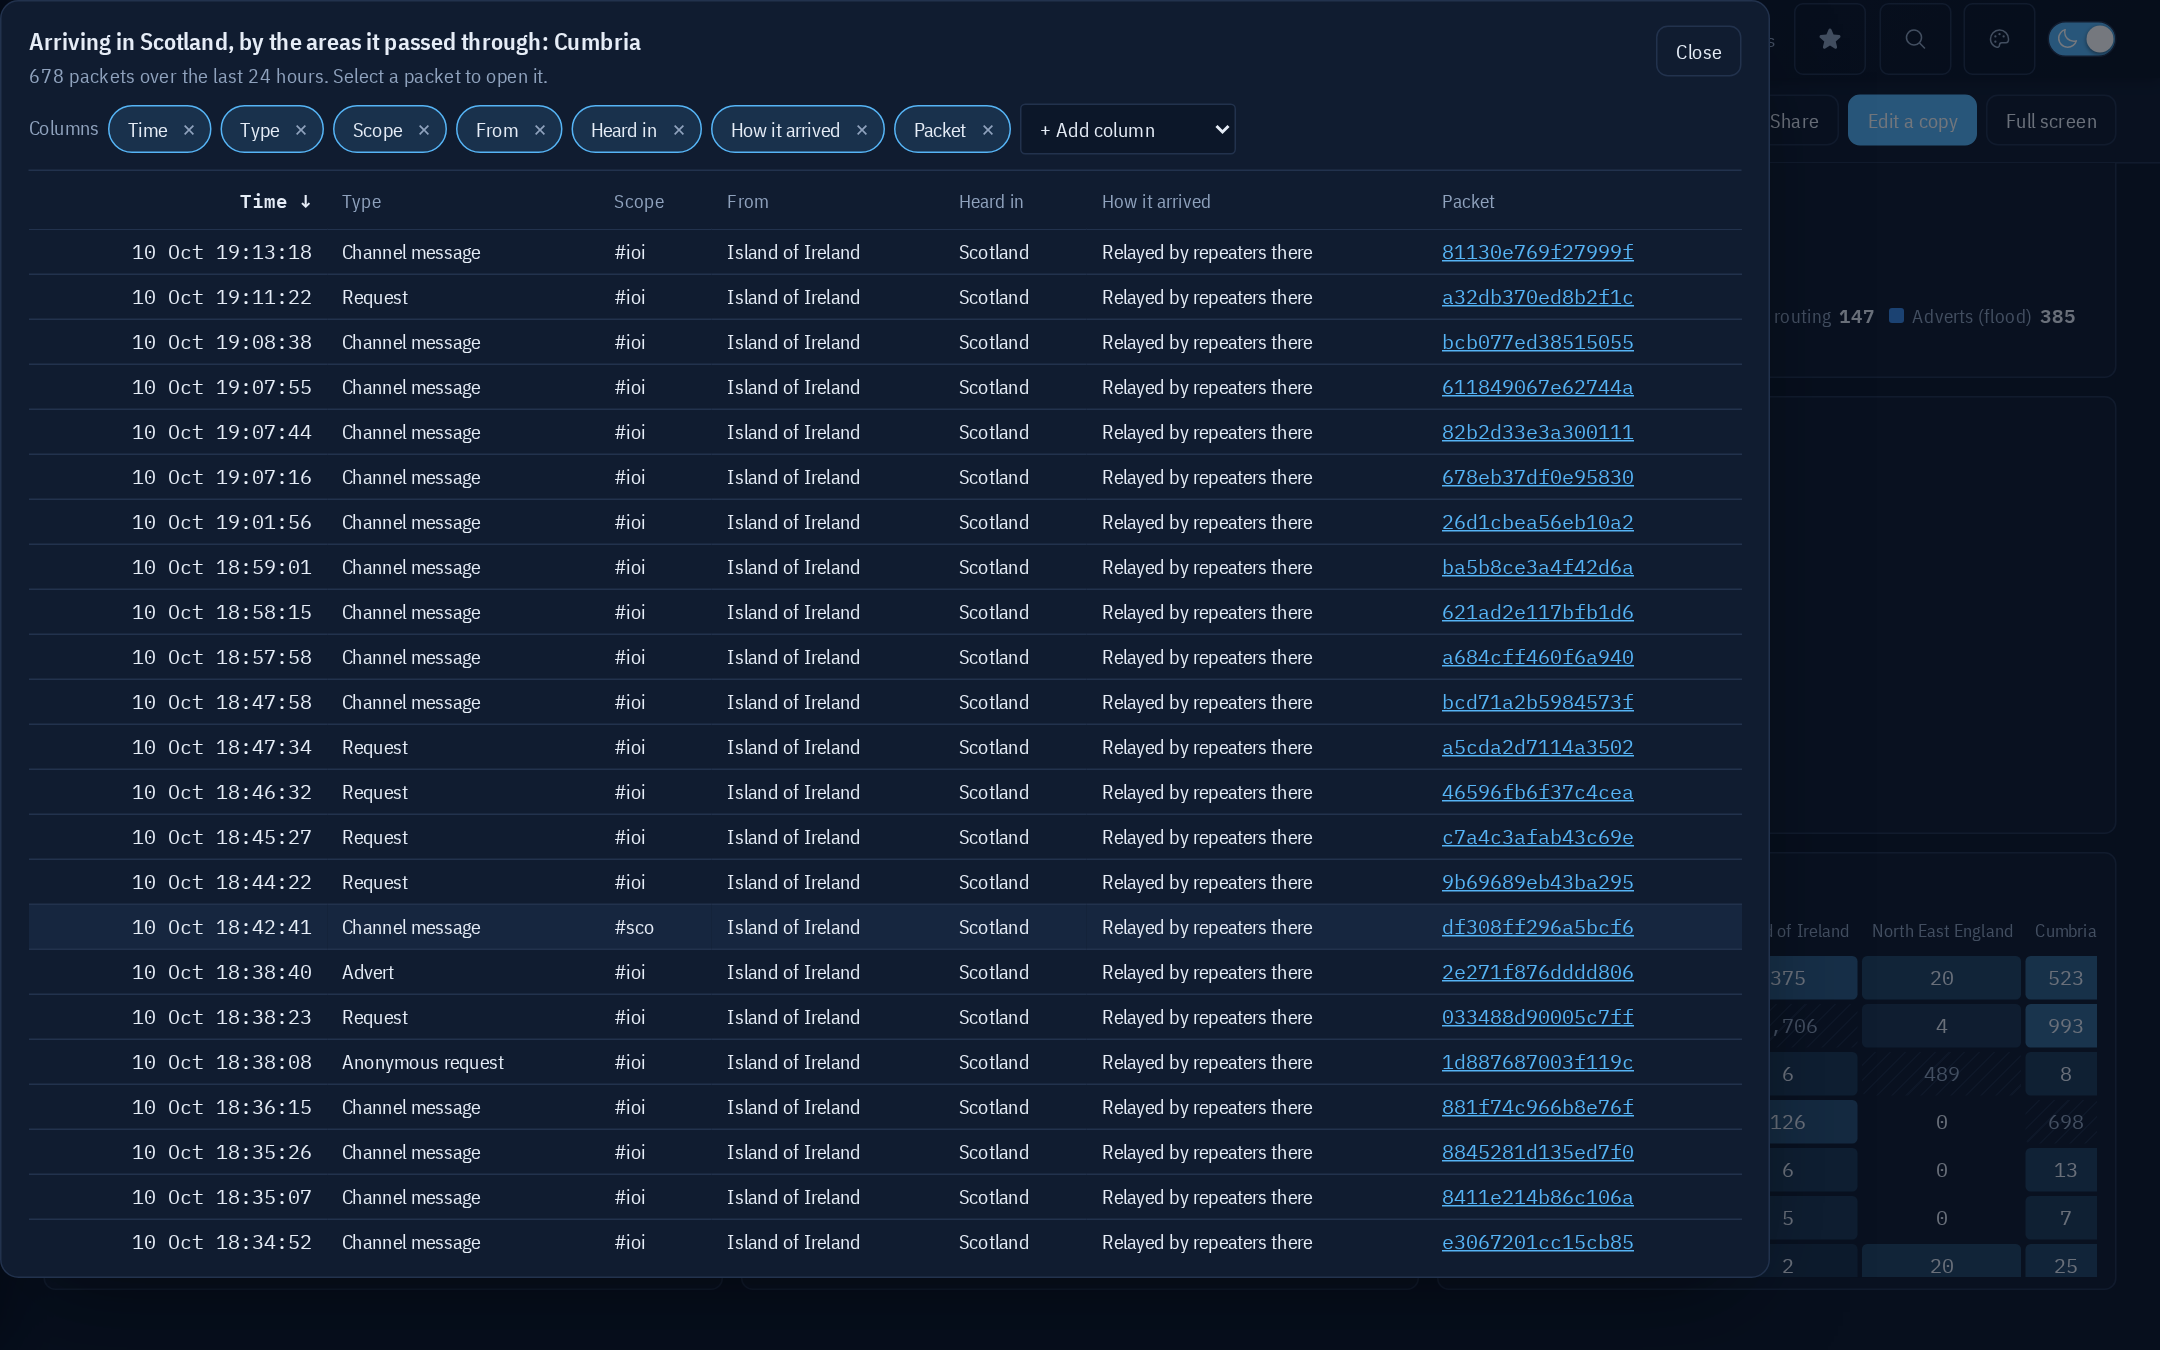
The packets behind a figure:
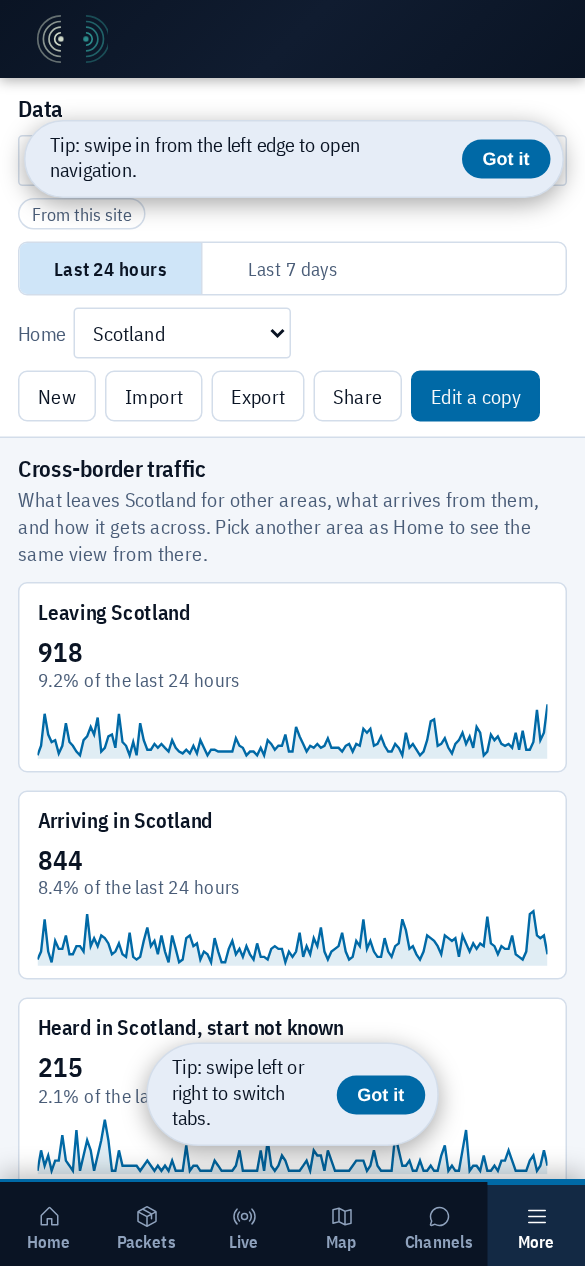
Phone (390 px): panels stack in reading order:
Checks
🤖 Generated with Claude Code |


…l event (Kpa-clawbot#2177) (Kpa-clawbot#2178)

Closes Kpa-clawbot#2177.

## What

Node notifications can mail alerts computed outside CoreScope. With
`userManagement.notifications.externalAlerts` configured, users can
choose a new event, `node.external`, which is off by default and only
offered when configured:

```json
"notifications": {
  "enabled": true,
  "externalAlerts": { "url": "http://coverage-job/alerts.json", "maxAgeHours": 48, "label": "Coverage" }
}
```

The feed:

```json
{ "generatedAt": "2026-10-11T01:35:12Z",
  "alerts": [ { "pubkey": "<64 hex>", "key": "SE", "text": "never heard to the south-east", "url": "https://example.org/coverage" } ] }
```

Mail lines: `<name>: Coverage: never heard to the south-east, <time>`
when an alert appears, `<name>: Coverage resolved (SE), <time>` when it
is gone from a fresh feed.

## How

- `cmd/server/notify_external.go`: feed types, `parseExternalFeed` (RFC
3339 `generatedAt`, age check, per-alert validation),
`fetchExternalFeed` (200 only, 1 MB cap, 10 s timeout).
- `notify_eval.go`: `evalExternal`. Subjects are `<pubkey>/<key>`; a
`<pubkey>/*` row is the per-node baseline, so the first fresh feed after
watching stores the current alerts without a mail (like `foreign.new`),
and later alerts mail at once. `External == nil` (not configured, nobody
chose it, or stale) leaves every `node.external` state as it is.
- `notify_service.go`: the feed is fetched only when configured and at
least one user chose the event. Each new reason the feed is unusable is
logged once, and so is the recovery. Mail text and link: the alert's
`url`, otherwise the node page.
- `notify_handlers.go`: `availableEvents` and the new `externalLabel`
include the event only when configured; PUT answers 400 for
`node.external` otherwise.
- `internal/users/notify.go`: event constant, `OptionalNodeNotifyEvents`
(canonical order: node, optional, admin), `RemoveWatch` also deletes the
node's `<pubkey>/...` rows.
- Account page label, OpenAPI descriptions, `config.example.json`
comment, `docs/user-guide/accounts.md` section.

Decisions on the three open questions in Kpa-clawbot#2177: the generic name
`node.external`; the resolved mail names the key instead of repeating
the text, so there is **no `users.db` schema change** (a bump would also
make older binaries refuse the file); one feed.

## Invariants

- Read/write separation (Kpa-clawbot#1283): the server only reads the feed over
HTTP. State rows go to `users.db` through `internal/users`, like the
other events.
- A dead, garbled or old feed never mails "resolved":
`TestEvaluateExternalStaleFeedChangesNothing` and
`TestNotifierMailsExternalAlertsAndSkipsAStaleFeed` (HTTP 502 and a 72 h
old feed in a row, then a fresh empty feed resolves).

## Performance

The evaluator adds one pass over the stored states (already read every
tick) plus, per user with the event on and per watched node, the node's
current alerts. Bounded by `maxWatchesPerUser` (50) times the alerts per
node. The feed is fetched once per tick (default 5 minutes) only when
someone chose the event, capped at 1 MB. No packet-store lock is taken
for it. Nothing changes for instances without `externalAlerts`.

## Tests

- `cmd/server`: `go test` green locally (Windows;
`TestSaveGeoFilterPreservesFileMode` skipped as it needs Unix mode
bits). New: `notify_external_test.go` (feed parsing and limits, HTTP
fetch 200/404/oversized, config resolution, evaluator
baseline/new/resolved/returning/stale/not chosen/notifications off,
notifier end to end with a fake feed, account routes).
- `internal/users`: green, 2 new tests (optional event and canonical
order, `RemoveWatch` deletes external subjects only for that node).
- Frontend: `test-all.sh` green, 1 new test in
`test-notifications-ui.js` (label from `externalLabel`, escaped).
- `scripts/check-xss-sinks.sh --file public/notifications.js`: clean.

## Not done

- No E2E test: the account page change is one label, covered by the unit
test.
- Not run against a live instance yet. The first feed in use is the
coverage job of on8ar.eu (`alerts.json`, 29 alerts at the moment).

Co-authored-by: Claude Opus 5.5 <noreply@anthropic.com>

…awbot#2160)

Fixes Kpa-clawbot#2159. Related to Kpa-clawbot#1995.

Standalone release tests failed when `GITHUB_REF_NAME` was absent and
could use an unrelated runner tag when it was present. Supply the
simulated tag explicitly; exercise the real release-notes step with both
missing and unrelated host values, including present and absent notes
files.

Two filesystem fixtures now report unsupported Windows capabilities
explicitly: POSIX permission bits, and symlink creation denied with
error 1314. Unix mode checks and all symlink safety assertions remain
intact; other symlink setup errors still fail. Production code and
workflows are unchanged. This is 29 added lines across three test files.

Validation: reproduced all three failures before fixing them; focused
regressions, the full standalone frontend suite, and native Go
server/ingestor suites pass. The POSIX permission and unprivileged
Windows symlink fixtures are explicitly skipped on this host and remain
enabled in Linux CI. The browser smoke suite passed 148 checks, with
three fixture-dependent skips and two pre-existing disabled cases. No
configuration or customizer changes.
…-clawbot#2161)

Refs Kpa-clawbot#1739. Depends on the small local-validation fix in Kpa-clawbot#2160; merge
that first. This branch contains its prerequisite commit plus one
migration-status commit.

An interrupted background migration currently records `failed`, making
an operator shutdown look like a migration fault. Errors matching
`context.Canceled`, including wrapped errors, now record `cancelled` and
retain the error and completion time without logging `FAILED`. Ordinary
errors, deadline expiry and panics remain failures even when the context
is cancelled; a successful callback still records `done`.

Cancelled work follows the existing retry path on the next run.
Regression tests cover classification and clearing stale
completion/error fields before retrying, then successful completion. The
migration runbook documents the distinction.

This covers the existing ingestor bookkeeping portion of Kpa-clawbot#1739. The
issue's server status mapper and banner depend on closed, unmerged Kpa-clawbot#1735
and are absent from current master; this PR does not add that API/UI and
leaves Kpa-clawbot#1739 open for the remaining scope. No new configuration,
customizer setting or schema migration is required.

Validation: direct and wrapped cancellation failed the new regression
before the change; focused tests and the race check pass afterward.
Native full server/ingestor suites and all 194 standalone frontend
suites pass with Kpa-clawbot#2160. The browser smoke suite passed 148 checks, with
three fixture-dependent skips and two pre-existing disabled cases.
Windows-only filesystem capability skips are documented in Kpa-clawbot#2160; Linux
CI retains the security assertions.

Performance impact: one error-chain check when a background migration
finishes, using the existing single status update. No packet-ingestion
loop, batching, polling or retention behavior changes, and no speedup is
claimed.

## Summary

The subpath index keeps every contiguous run of 2-8 hops from every
stored transmission's path, in two maps:

- `spIndex`: key → count
- `spTxIndex`: key → transmissions containing that subpath, one entry
per occurrence

Both were always updated together (the only production callers were
`addTxToSubpathIndexFull` / `removeTxFromSubpathIndexFull`, which touch
both), so every count equalled `len(spTxIndex[key])`. The existing
`TestSubpathTxIndexPopulated` asserted exactly that. The index therefore
held its 1M+ keys twice.

This PR removes `spIndex`. The two analytics consumers read `len(txs)`,
and the add/remove helpers take only the transaction map. No API
response changes.

No existing upstream issue covers this; it came out of profiling a
production instance where garbage collection was 87% of CPU (30 s CPU
profile: `gcDrain` 39.9 s of 45.9 s sampled) with an 805 MB live heap
against a 1 GiB `GOMEMLIMIT`. That heap profile put 186 MB in this
index; on that instance's 7-day window there are 1.2M distinct subpath
keys (79% seen once) and 3.07M entries.

## Performance

### Go benchmark

`BenchmarkBuildSubpathIndex` builds the index for a synthetic,
production-shaped window: 41k transmissions with path lengths drawn from
the production hop-count histogram, and hops from random walks over a
400-node graph with 3-byte prefixes. That gives 1.48M keys, 85% seen
once (production: 1.2M, 79%). No real data is used. 10 runs each:

```
cpu: AMD Ryzen 5 3600XT 6-Core Processor
                     │    master    │              this PR               │
                     │    sec/op    │   sec/op     vs base               │
BuildSubpathIndex-12    2.157 ± 1%    1.610 ± 5%  -25.33% (p=0.000 n=10)

                     │  retained-B  │  retained-B   vs base              │
BuildSubpathIndex-12   238.5Mi ± 0%   187.7Mi ± 0%  -21.31% (p=0.000 n=10)

                     │     B/op     │     B/op      vs base              │
BuildSubpathIndex-12   572.0Mi ± 0%   465.6Mi ± 0%  -18.61% (p=0.000 n=10)
```

(`retained-B` is the live heap the index keeps after a forced GC: 250.1
MB → 196.8 MB.)

### Staging heap

Live heap after a forced GC (`/debug/pprof/heap?gc=1`), on a staging
host running a copy of a production database and its live MQTT feed,
attributed to the subpath index builder:

| | master | this PR |
|---|---|---|
| subpath index (`buildSubpathIndex`, cum) | 172.4 MB | 116.1 MB |
| packets in memory at the time | 27,521 | 24,086 |
| per packet | 6.27 KB | 4.82 KB (**-23%**) |

The two snapshots were taken minutes apart with different numbers of
packets loaded, hence the per-packet figure; it agrees with the
benchmark's -21%.

The same A/B replay used for the other PRs (30 minutes of real
production API traffic) showed no latency change (p50 10.3 ms vs 10.7
ms, p95 59.5 ms vs 52.9 ms, 0 errors). GC count and CPU were lower in
this run (44 → 28 collections, 13.0% → 9.6% CPU), but runs on this
shared host vary by that much on their own, so no claim is made from
them.

## Tests

- Red commit `ded359ff`: the fixture, `TestSubpathFixtureShape` (keeps
the fixture production-like: 60-95% singleton keys),
`BenchmarkBuildSubpathIndex`, and `TestSubpathIndexRetainedHeap`, which
allows at most 225 MB for the 41k fixture. It fails on `master` with
250.1 MB.
- Green commit `e399c561`: the change. The heap test passes at about 197
MB.
- `make test`: 16 of 16 modules pass; `go test -race` over the subpath,
eviction, path-hop and resolved-index tests passes.

Test changes in the green commit are mechanical, as required for a
structural change:

- struct literals stop setting `spIndex`; where a literal did not set
`spTxIndex` it now does, because appending to a nil map panics where the
old code skipped the transaction map when passed `nil`;
- count assertions read `len(spTxIndex[key])`;
- the old "spIndex and spTxIndex agree" check becomes "no key is kept
with an empty list", which is what keeps `len()` a correct count.

## Review notes

- Removal still takes out one occurrence per subpath occurrence and
deletes a key whose list becomes empty, so `len()` stays equal to the
old count through eviction.
- The store's memory estimate (`perSubpathEntryBytes`) is unchanged
here; accounting accuracy is a separate item.
- No new `map[string]interface{}`.

## SonarLint

SonarQube Community rules (the SonarLint engine) were run on the files
this PR touches, and only issues on lines it adds are listed.

- **Fixed** in `8af9582f`: S3776 (cognitive complexity 16 > 15) in the
test fixture. Path generation is split into graph and hop-count helpers;
the random draws stay in the same order, so the fixture is unchanged.

## Checked against the repo rules

- Rebased onto `master` (`673442cc`). Each red commit was re-run and
still fails on its assertions; each green commit passes (TDD.md).
- `make test`: all 16 modules pass. Frontend suites: all pass except
`test-issue-1956-release-routing.js`, which needs CI's `GITHUB_REF_NAME`
and fails the same way on `master` locally (Kpa-clawbot#2160 addresses it).
- No private data: test fixtures and examples use the codes the existing
tests use (SJC/SFO/LAX, `#be`-style scopes).
- No new `map[string]interface{}`, no hard-coded colours. `git add` was
explicit, and there is one logical change per commit.

🤖 Generated with [Claude Code](https://claude.com/claude-code)

https://claude.ai/code/session_01KaR4xu8gVykQBkH8yG8m6H

---------

Co-authored-by: Claude Opus 5.5 <noreply@anthropic.com>
…idden tabs (Kpa-clawbot#2162)

## Summary

The nav bar's packet / node / observer counts were refreshed three ways
at once: a 15 s timer, every batch of live WebSocket packets
(`debouncedOnWS`, 250 ms), and the `/stats` client cache being cleared
every 5 s while packets arrive. None of them checked whether the tab was
visible. So every open tab, including hidden ones, asked `/api/stats`
every few seconds for as long as it stayed open.

On one production instance's nginx log for a single day, `/api/stats`
was **135,654 of 187,411** CoreScope API requests (72%), about 20,000 a
day for each browser that kept a tab open. Each response is cheap thanks
to the 10 s server-side cache (Kpa-clawbot#1910), so this is about request volume,
bandwidth and log noise, not server CPU.

This PR adds `createVisibleThrottle()` to `app.js` and routes all three
triggers through one throttled refresh:

- at most one `/api/stats` request per 15 s from a visible tab (the old
timer's own period);
- none from a hidden tab;
- one immediate refresh when a hidden tab becomes visible again.

No existing issue covers this.

## Performance

Measured with headless Chromium, counting `/api/stats` requests from a
real tab: 60 s visible, then 60 s with the page hidden
(`document.hidden` and a `visibilitychange` event), then back to
visible.

| `/api/stats` requests | production (current release) | staging,
`master` | staging, this PR |
|---|---|---|---|
| visible tab, per minute | 9 | 4 | 4 (at +10, +25, +40, +55 s) |
| hidden tab, per minute | 6 | 5 | **0** |
| on return to visible | n/a | n/a | 1, immediately |

The same check confirmed the nav bar still renders its counts (`… pkts ·
… nodes · … obs`).

## Tests

- Red commit `2c81a3e4`: `tests/unit/test-nav-stats-throttle.js` loads
the real `public/app.js` in a `vm` context. `createVisibleThrottle`
lands as a pass-through stub, so the test fails on its first assertion
(40 refreshes where 1 is expected).
- Green commit `f0ba92ab`: the throttle, and the nav stats timer, WS
hook and a new `visibilitychange` listener calling one throttled
trigger. All 6 cases pass: one refresh per burst, again after the
interval, at most 241 an hour, none while hidden, one on return, and a
source check that `updateNavStats` is wrapped and not called by the
timer directly.
- Added to `test-all.sh` in sorted order; `test-test-inventory.js`
passes.
- Frontend suites: 194 of 195 pass. The one failure,
`test-issue-1956-release-routing.js`, needs CI's `GITHUB_REF_NAME` and
fails the same way on `master` locally.

## Review notes

- `home.js` keeps its own one-shot `/stats` load on the home page; only
the nav bar's polling changed.
- A tab opened in the background loads its counts when it is first
shown.
- The 15 s interval is a constant at the call site. Could be exposed in
the customizer later (AGENTS.md rule 8); not added here.
- No Playwright E2E added: the change is timing behaviour, covered by
the unit test against the real file and by the browser measurement
above. Happy to add an E2E if wanted.

## SonarLint

SonarQube Community rules (the SonarLint engine) were run on the files
this PR touches, and only issues on lines it adds are listed.

- **Fixed** in `9eb94ea1`: `node:` specifiers (S7772).
- **Kept on purpose:**
- S7773 wants `Number.isFinite`/`Number.parseInt` for the `isFinite` and
`parseInt` handed to the `vm` sandbox, but `app.js` calls the global
functions, so those are the ones it needs.
- S1523 flags `vm.runInContext`, which is how the frontend unit tests
load the repo's own `public/app.js`.

## Checked against the repo rules

- Rebased onto `master` (`673442cc`). Each red commit was re-run and
still fails on its assertions; each green commit passes (TDD.md).
- `make test`: all 16 modules pass. Frontend suites: all pass except
`test-issue-1956-release-routing.js`, which needs CI's `GITHUB_REF_NAME`
and fails the same way on `master` locally (Kpa-clawbot#2160 addresses it).
- No private data: test fixtures and examples use the codes the existing
tests use (SJC/SFO/LAX, `#be`-style scopes).
- No new `map[string]interface{}`, no hard-coded colours. `git add` was
explicit, and there is one logical change per commit.

🤖 Generated with [Claude Code](https://claude.com/claude-code)

https://claude.ai/code/session_01KaR4xu8gVykQBkH8yG8m6H

---------

Co-authored-by: Claude Opus 5.5 <noreply@anthropic.com>
… s (Kpa-clawbot#2165)

## Summary

`/api/nodes` scans every node row into a map, enriches it (hash size,
multi-byte capability, relay info, usefulness scores, declared scope)
and encodes the page on **every** request. On one production instance (2
vCPU / 2 GB) that was **95 GB of allocation in 45 hours, about 6.7 MB
per request and a quarter of all bytes allocated**, on a process where
garbage collection was 87% of CPU.

The queries repeat heavily. In that instance's nginx log for one day,
three pages of one query (`limit=500&offset=0|500|1000&lastHeard=30d`)
were 10,000 of the 14,053 `/api/nodes` requests.

This PR keeps the encoded response for 15 s per distinct query:

- `handleNodes` serves the cached bytes when it can; otherwise it builds
through `buildNodesResponse` (the old handler body, unchanged apart from
returning instead of writing) inside a singleflight, so concurrent
identical misses share one build.
- **Cache key:** blacklist generation | hidden-prefix generation |
sorted query string. Parameter order does not split the cache, and any
change to either filter list misses it at once. This is the pattern
`/api/nodes/{pubkey}/reach` already uses (Kpa-clawbot#1629).
- `setGeoFilter` drops the cache, so a geo-filter change through the
admin endpoint shows immediately.
- **Bounded twice:** by `maxCacheEntries` (256) like the other keyed
caches, and by bytes, since a full-list response is several MB. Expired
entries are dropped on every insert, the total is capped at 32 MB, and a
single response over 8 MB is not cached.
- **15 s** matches the relay/usefulness caches the response is built
from (Kpa-clawbot#1257); the client already keeps its own node list for 90 s.

Related to Kpa-clawbot#2146: `/api/nodes` is in its endpoint table (144 s max on
one instance). This PR reduces how often the handler runs and allocates,
not the SQL wait the issue is about, so it is not a fix for it.

## Performance

### Go benchmarks

1,100 nodes, half repeaters, 10 runs each:

```
cpu: AMD Ryzen 5 3600XT 6-Core Processor
                       │    master     │              this PR                 │
                       │    sec/op     │    sec/op     vs base                │
HandleNodesRepeated-12   5991.14µ ± 3%    41.21µ ± 7%  -99.31% (p=0.000 n=10)
HandleNodesUnique-12       6.010m ± 2%    5.967m ± 0%        ~ (p=0.393 n=10)

                       │     B/op      │     B/op      vs base                │
HandleNodesRepeated-12   1611.0Ki ± 1%   240.9Ki ± 0%  -85.05% (p=0.000 n=10)
HandleNodesUnique-12      1.566Mi ± 1%   1.753Mi ± 1%  +11.96% (p=0.000 n=10)
```

`Repeated` is one query asked over and over (the production pattern).
`Unique` makes every request a different query, so nothing is served
from cache: the time is unchanged, and it allocates 12% more because the
body is now built in memory so it can be kept.

### Expected hit rate

Replaying that day's 14,053 `/api/nodes` requests through a cache of
each lifetime:

| TTL | served from cache |
|---|---|
| 5 s | 39% |
| 10 s | 47% |
| **15 s** | **52%** |
| 30 s | 58% |
| 60 s | 69% |

### Staging A/B

The same 30 minutes of real production API traffic (5,640 requests, 279
of them `/api/nodes`), replayed at 2x on a staging host against a copy
of a production database, on `master` and on this branch:

| `/api/nodes` | master | this PR |
|---|---|---|
| p50 | 47.1 ms | **31.0 ms** |
| p95 | 165.4 ms | **114.4 ms** |
| max | 759.9 ms | 321.7 ms |
| allocated by `handleNodes` during the replay | 1,000 MB | **594 MB
(-41%)** |
| total allocated by the process | 3,704 MB | 3,349 MB (-10%) |

The -41% matches the expectation from the hit rate and the miss-path
cost: about 0.48 × 1.12 + 0.52 × 0.15 ≈ 0.61 of the old allocation.

## Tests

- Red commit `ab33bc29`: a test-only build hook, the tests and both
benchmarks. Three fail on `master`: identical queries are built once,
reordered parameters share an entry, ten concurrent misses share one
build. Three more guard against over-caching and pass on both commits:
different queries are built separately, an expired entry is rebuilt, a
geo-filter change drops entries.
- Green commit `ea0d1cf2`: the cache, plus
`TestHandleNodes_FilterListChangesMissCache` (hidden-prefix and
blacklist changes miss the cache) and `TestNodesCache_BoundedByBytes`
(stays under 32 MB; an oversized response is not cached).
- One existing test changed: `TestHandleNodesRegionUsesStore` already
clears the store's own 30 s region cache by hand before its second
request; it now clears this cache on the same line.
`TestHiddenNamePrefix_1181_NodesList`, which changes the hidden-prefix
list between requests, passes unchanged because the generation is in the
key.
- `go test -race` on the new tests passes. `make test`: 16 of 16 modules
pass.

## Review notes

- The response depends only on the query string and server state, not on
who is asking (no auth or header-dependent output in the handler), so a
shared cache is safe.
- `writeJSONBytes` writes the cached bytes with the same `Content-Type`
and status as `writeJSON`; the body has the trailing newline
`json.Encoder` adds, so output is byte-identical.
- No new `map[string]interface{}` added (the existing node maps are
unchanged; converting them to a struct is a separate, larger job).
- The TTL and byte budget are constants. They could be operator settings
later (AGENTS.md rule 8); not added here.

## SonarLint

SonarQube Community rules (the SonarLint engine) were run on the files
this PR touches, and only issues on lines it adds are listed.

- **S3776 on `buildNodesResponse`:** complexity 91. That is upstream's
existing handler body moved unchanged (it is also 91 on `master`); this
PR makes the handler itself simpler.
- **Fixed** in `25d40950`: the test hook moved to the cache-miss path,
so the builder stays identical to the old body rather than one point
above it. Splitting that function is a refactor of its own.

## Checked against the repo rules

- Rebased onto `master` (`673442cc`). Each red commit was re-run and
still fails on its assertions; each green commit passes (TDD.md).
- `make test`: all 16 modules pass. Frontend suites: all pass except
`test-issue-1956-release-routing.js`, which needs CI's `GITHUB_REF_NAME`
and fails the same way on `master` locally (Kpa-clawbot#2160 addresses it).
- No private data: test fixtures and examples use the codes the existing
tests use (SJC/SFO/LAX, `#be`-style scopes).
- No new `map[string]interface{}`, no hard-coded colours. `git add` was
explicit, and there is one logical change per commit.

🤖 Generated with [Claude Code](https://claude.com/claude-code)

https://claude.ai/code/session_01KaR4xu8gVykQBkH8yG8m6H

---------

Co-authored-by: Claude Opus 5.5 <noreply@anthropic.com>
…pa-clawbot#2166)

## Summary

`/api/scope-stats` averaged **2.6 s on one production instance (max 17.7
s)**, whatever the window. Four of its five queries take 10-100 ms on
that database. The fifth, the per-region count, took **2.5-2.9 s for
every window, 1h included**: SQLite chose `idx_tx_scope_name`
(`scope_name > ''`) and walked every scoped transmission ever stored (45
days of them), filtering by `first_seen` afterwards.

```
SEARCH transmissions USING INDEX idx_tx_scope_name (scope_name>?) | USE TEMP B-TREE FOR ORDER BY
```

A unary `+` on every `scope_name` reference in that query (`WHERE …
+scope_name …`, `GROUP BY +scope_name`) stops the planner using that
index. The query then searches the window on
`idx_transmissions_first_seen` and groups in a temp b-tree, the same
idiom the `advertsByRole` query in the same function already uses for
`payload_type`. Putting `+` in the `WHERE` alone is not enough: the
planner then walks `idx_tx_scope_name` to avoid sorting for the `GROUP
BY`, which is just as slow; the `GROUP BY +scope_name` is what fixes it.

```
SEARCH transmissions USING INDEX idx_transmissions_first_seen (first_seen>?) | USE TEMP B-TREE FOR GROUP BY | USE TEMP B-TREE FOR ORDER BY
```

Related to Kpa-clawbot#2146, which lists `/api/scope-stats` (2.3 s average on one
instance) and records the 24 h summary as 7 ms warm there. On the
instance measured here the per-region query planned onto
`idx_tx_scope_name` and took 2.5-2.9 s for every window; this PR fixes
that plan. Not marked as a fix: Kpa-clawbot#2146 is about pool and lock waits.

## Results are identical

On a copy of the production database, the old and new query run inside
**one read transaction** (same snapshot) return exactly the same rows
for 1h, 24h, 7d and 45d (5, 10, 12 and 18 regions; 73, 2,024, 13,822 and
76,083 transmissions). `TestScopeStatsByRegion_CountsMatchWindow` also
checks the per-region counts against a direct count of the window.

## Performance

### The query alone, on a copy of the production database

311k transmissions, 76k of them region-scoped over 45 days; best of
three:

| window | before | after |
|---|---|---|
| 1h | 2,530 ms | 0.1 ms |
| 24h | 2,570 ms | 11.6 ms |
| 7d | 2,876 ms | 124 ms |

### The endpoint, on staging

Cold `GET /api/scope-stats` (the response cache is 30 s, so each sample
is a full compute) on a staging host with a copy of a production
database and its live feed; two samples each, 32 s apart:

| window | master | this PR |
|---|---|---|
| 1h | 3.08 s, 2.83 s | **16 ms, 12 ms** |
| 24h | 2.69 s, 2.79 s | **131 ms, 101 ms** |
| 7d | 3.35 s, 4.53 s | **626 ms, 663 ms** |

### Go benchmark

`BenchmarkGetScopeStats24h`: all five scope-stats queries for 24h, on
300k transmissions spread over 45 days (a quarter region-scoped), with
production's tables and both competing indexes and `ANALYZE` run as
production does (Kpa-clawbot#2072). 10 runs:

```
cpu: AMD Ryzen 5 3600XT 6-Core Processor
                    │   master    │             this PR              │
GetScopeStats24h-12   33.186m ± 3%   8.058m ± 6%  -75.72% (p=0.000 n=10)
```

The fixture is smaller and better cached than production, which is why
the absolute times are lower than above; the plan change is the same.

## Tests

- Red commit `a7dcf98f`: moves the query into `scopeStatsByRegionQuery`
(unchanged), adds the fixture, the benchmark,
`TestScopeStatsByRegion_UsesFirstSeenIndex` (`EXPLAIN QUERY PLAN` must
use `idx_transmissions_first_seen` and not `idx_tx_scope_name`; fails on
`master` with exactly the production plan shown above) and
`TestScopeStatsByRegion_CountsMatchWindow` (passes on both commits;
guards correctness).
- Green commit `f9ba986b`: the `+` hints and a comment explaining them.
- All existing scope-stats tests pass; `make test`: 16 of 16 modules
pass.

## Review notes

- Only the per-region query changes; the summary, non-transport,
time-series and adverts-by-role queries already search by `first_seen`.
- If `idx_transmissions_first_seen` were ever missing, the query would
still run correctly (full scan); `+` only removes `idx_tx_scope_name`
from consideration, unlike `INDEXED BY`, which would make the query
fail.
- `/api/scope-stats` still has no singleflight around its 30 s cache
(unlike stats, channels and the scope audit). With the query now well
under a second it matters much less; left for a separate change.

## SonarLint

SonarQube Community rules (the SonarLint engine) were run on the files
this PR touches, and only issues on lines it adds are listed.

- No issues on the added lines.

## Checked against the repo rules

- Rebased onto `master` (`673442cc`). Each red commit was re-run and
still fails on its assertions; each green commit passes (TDD.md).
- `make test`: all 16 modules pass. Frontend suites: all pass except
`test-issue-1956-release-routing.js`, which needs CI's `GITHUB_REF_NAME`
and fails the same way on `master` locally (Kpa-clawbot#2160 addresses it).
- No private data: test fixtures and examples use the codes the existing
tests use (SJC/SFO/LAX, `#be`-style scopes).
- No new `map[string]interface{}`, no hard-coded colours. `git add` was
explicit, and there is one logical change per commit.

🤖 Generated with [Claude Code](https://claude.com/claude-code)

https://claude.ai/code/session_01KaR4xu8gVykQBkH8yG8m6H

---------

Co-authored-by: Claude Opus 5.5 <noreply@anthropic.com>
…pa-clawbot#2142, API) (Kpa-clawbot#2167)

## Summary

Backend half of Kpa-clawbot#2142 (the page is the stacked PR Kpa-clawbot#2169).

`GET /api/scope-audit` lists only repeaters that have answered a
declared-regions request: 17 of almost 200 nodes on the instance the
request came from. This adds a transport view, `GET
/api/scope-audit?mode=transport&window=…[&scope=X]`, with one row per
repeater **seen forwarding** in the window:

- `transported`: the named region scopes it was seen carrying, each with
packets and first/last seen (most packets first), plus unscoped,
unmatched and ambiguous-hop counts;
- `asked`, `declaredRegions`, `notObserved`, `configState`, `declaredAt`
where a declared answer exists; `asked: false` with null declared fields
where it does not ("not asked" is not "declares nothing");
- with `scope=X` (spelled `be`, `#be` or `BE`): `carriesScope` on every
row and `carrying` / `notCarrying` counts, which is the rollout report
the issue asks for.

`mode=declared` (or no `mode`) is unchanged. An unknown `mode` is a 400.

Partial fix for Kpa-clawbot#2142: this PR provides the API; the page is Kpa-clawbot#2169 and
the observer region filter Kpa-clawbot#2171. The issue should only be considered
done once all three are in.

## How it follows the issue's notes

- **The scan does not change.** It is the same single
`ScopeAuditForwarding` pass, with every repeater and room in `nodes`
(plus any declared target) as a target instead of only the declared
ones. Same attribution rules: FLOOD-family route types only,
`minForwarderHopHexLen` (no 1-byte hops), and a hop whose prefix matches
more than one repeater is credited to none of them.
- **Identity lookup with 1,000+ pubkeys:** `scopeAuditNodeIdentities`
runs one `IN` query; exercised at 1,200 keys in the benchmark below.
- **Row count and response size:** measured below.
- **Cache:** the transport view is cached per window with the declared
view's TTLs (30 s; 5 min for 7d), under the same singleflight group with
a `transport|` key. The scope filter is applied to a copy of the cached
result, so one scan serves every scope. (`scope=`, not `region=`: across
the API `region=` is the observer IATA filter.)
- **Wording:** "transported" is documented as *seen carrying*, not
configured for; the declared side stays separate.

## Performance

`BenchmarkComputeScopeTransport`: 1,200 repeaters (Kpa-clawbot#1975 quotes an
instance with 1,179), 30k flood transmissions in the last 24h on 4-hop
paths of 3-byte prefixes, a third region-scoped:

```
BenchmarkComputeScopeTransport-12   5   219253727 ns/op   425.4 response-KB   1200 rows
```

219 ms per compute, served from cache for 30 s (24h) or 5 min (7d); a
425 KB uncompressed response for 1,200 rows. This is new code with no
"before"; the declared view's numbers are untouched (same scan, same
cache).

### On real data (a staging copy of a production database and its live
feed)

| request | rows | result | time |
|---|---|---|---|
| declared view, 24h | 16 | (unchanged) | |
| `mode=transport`, 24h | **385** repeaters seen forwarding, 16 of them
with a declared answer | | 1.5 s cold |
| `mode=transport&scope=<scope A>`, 7d | 664 | **51 carrying it, 613
not** | 14.4 s cold |
| `mode=transport&scope=%23<SCOPE B>` (`#` and capitals), 7d, same
window now cached | 664 | 237 carrying, 427 not | 0.35 s |

The 7d cold compute is the same full-window hop scan the declared view
already pays for 7d (its own TTL comment measures 16.7 s on a
live-shaped database); like the declared view it is then cached for 5
minutes, and every scope filter is served from that one scan.
- Commit `ceaeb56b` renamed the filter from `region=` to `scope=` after
opening; the real-data figures above were taken before the rename and
are otherwise the same code.

## Tests

- Red commit `2a9b1286`: response types and a `mode=transport` stub that
returns no rows, plus tests. Four fail on the stub:
- repeaters that never answered are listed with `asked: false` and null
declared fields (and the answered one with its declared list and
`notObserved`);
- `scope=fr` / `%23fr` / `FR` marks carriers and non-carriers and counts
them; no scope means no `carriesScope` or counts;
  - an unknown mode is a 400;
- the transport and declared views are cached separately (requesting one
does not serve the other).
- Also added, passing on the stub by construction: a repeater with no
traffic in the window is not listed; the node blacklist applies.
- Green commit `60c669f4`: the implementation, `docs/api-spec.md` (new
`mode` and `scope` parameters, a Transport view section with the
response shape), and the benchmark.
- `make test`: 16 of 16 modules pass, including every existing
scope-audit test.

## Review notes

- Hidden-name and blacklist filtering use the same rules as the declared
view.
- `newTestStoreWithDB` now takes `testing.TB` so the benchmark can use
it (callers unchanged).
- No new `map[string]interface{}`; the response is a named struct.
- No config added.

## SonarLint

SonarQube Community rules (the SonarLint engine) were run on the files
this PR touches, and only issues on lines it adds are listed.

- **Fixed** in `060668b6`: S3776 (cognitive complexity 41 > 15) in the
new `computeScopeTransport`. It is split into target, visibility, row
and sort helpers; the response is the same and the transport tests are
unchanged.

## Checked against the repo rules

- Rebased onto `master` (`673442cc`). Each red commit was re-run and
still fails on its assertions; each green commit passes (TDD.md).
- `make test`: all 16 modules pass. Frontend suites: all pass except
`test-issue-1956-release-routing.js`, which needs CI's `GITHUB_REF_NAME`
and fails the same way on `master` locally (Kpa-clawbot#2160 addresses it).
- No private data: test fixtures and examples use the codes the existing
tests use (SJC/SFO/LAX, `#be`-style scopes).
- No new `map[string]interface{}`, no hard-coded colours. `git add` was
explicit, and there is one logical change per commit.

🤖 Generated with [Claude Code](https://claude.com/claude-code)

https://claude.ai/code/session_01KaR4xu8gVykQBkH8yG8m6H

---------

Co-authored-by: Claude Opus 5.5 <noreply@anthropic.com>
…t#2142, page) (Kpa-clawbot#2169) > **Requires Kpa-clawbot#2167 to be merged first.** This page calls the transport view API that Kpa-clawbot#2167 adds (`/api/scope-audit?mode=transport`), so it cannot be split from it; until Kpa-clawbot#2167 merges this PR also shows its commits. ## Summary Page half of Kpa-clawbot#2142. **Stacked on Kpa-clawbot#2167** (the API); review that first. Kpa-clawbot#2171 adds the observer region filter on top. Partial fix for Kpa-clawbot#2142 until all three are in. Adds a **Declared / Transport** toggle to `#/scope-audit`. The transport view calls `?mode=transport` and lists every repeater seen forwarding in the window: - **Seen carrying:** one chip per region scope with its packet count (first/last seen in the tooltip); - **Declared:** the repeater's declared regions coloured by whether they were seen carried (the declared view's own chips), or *not asked* when no declared-regions answer exists. Never asked is worded differently from declaring nothing; - **Other traffic:** unscoped, unmatched and ambiguous-hop counts. A **Region** box (suggestions from the scopes seen) adds a *Carries X* column, lists the repeaters not yet carrying it first, and summarises carriers against active non-carriers: the rollout report the issue asks for. Window, view and region are deep-linked (`#/scope-audit?window=7d&mode=transport&scope=be`) and survive a reload. The page says plainly that *transported* means seen carrying, not configured, and that over a short window a quiet region looks the same as a missing one. The intro text changes with the view. ## Screenshot The transport view with scope `be` typed in: every repeater seen forwarding in the last 24 h, whether it carries `be` (non-carriers first), the scopes it was seen carrying with counts, and its declared regions or *not asked*. Taken against `test-fixtures/e2e-fixture.db` with fictional `be` / `be-van` / `nl` scopes. 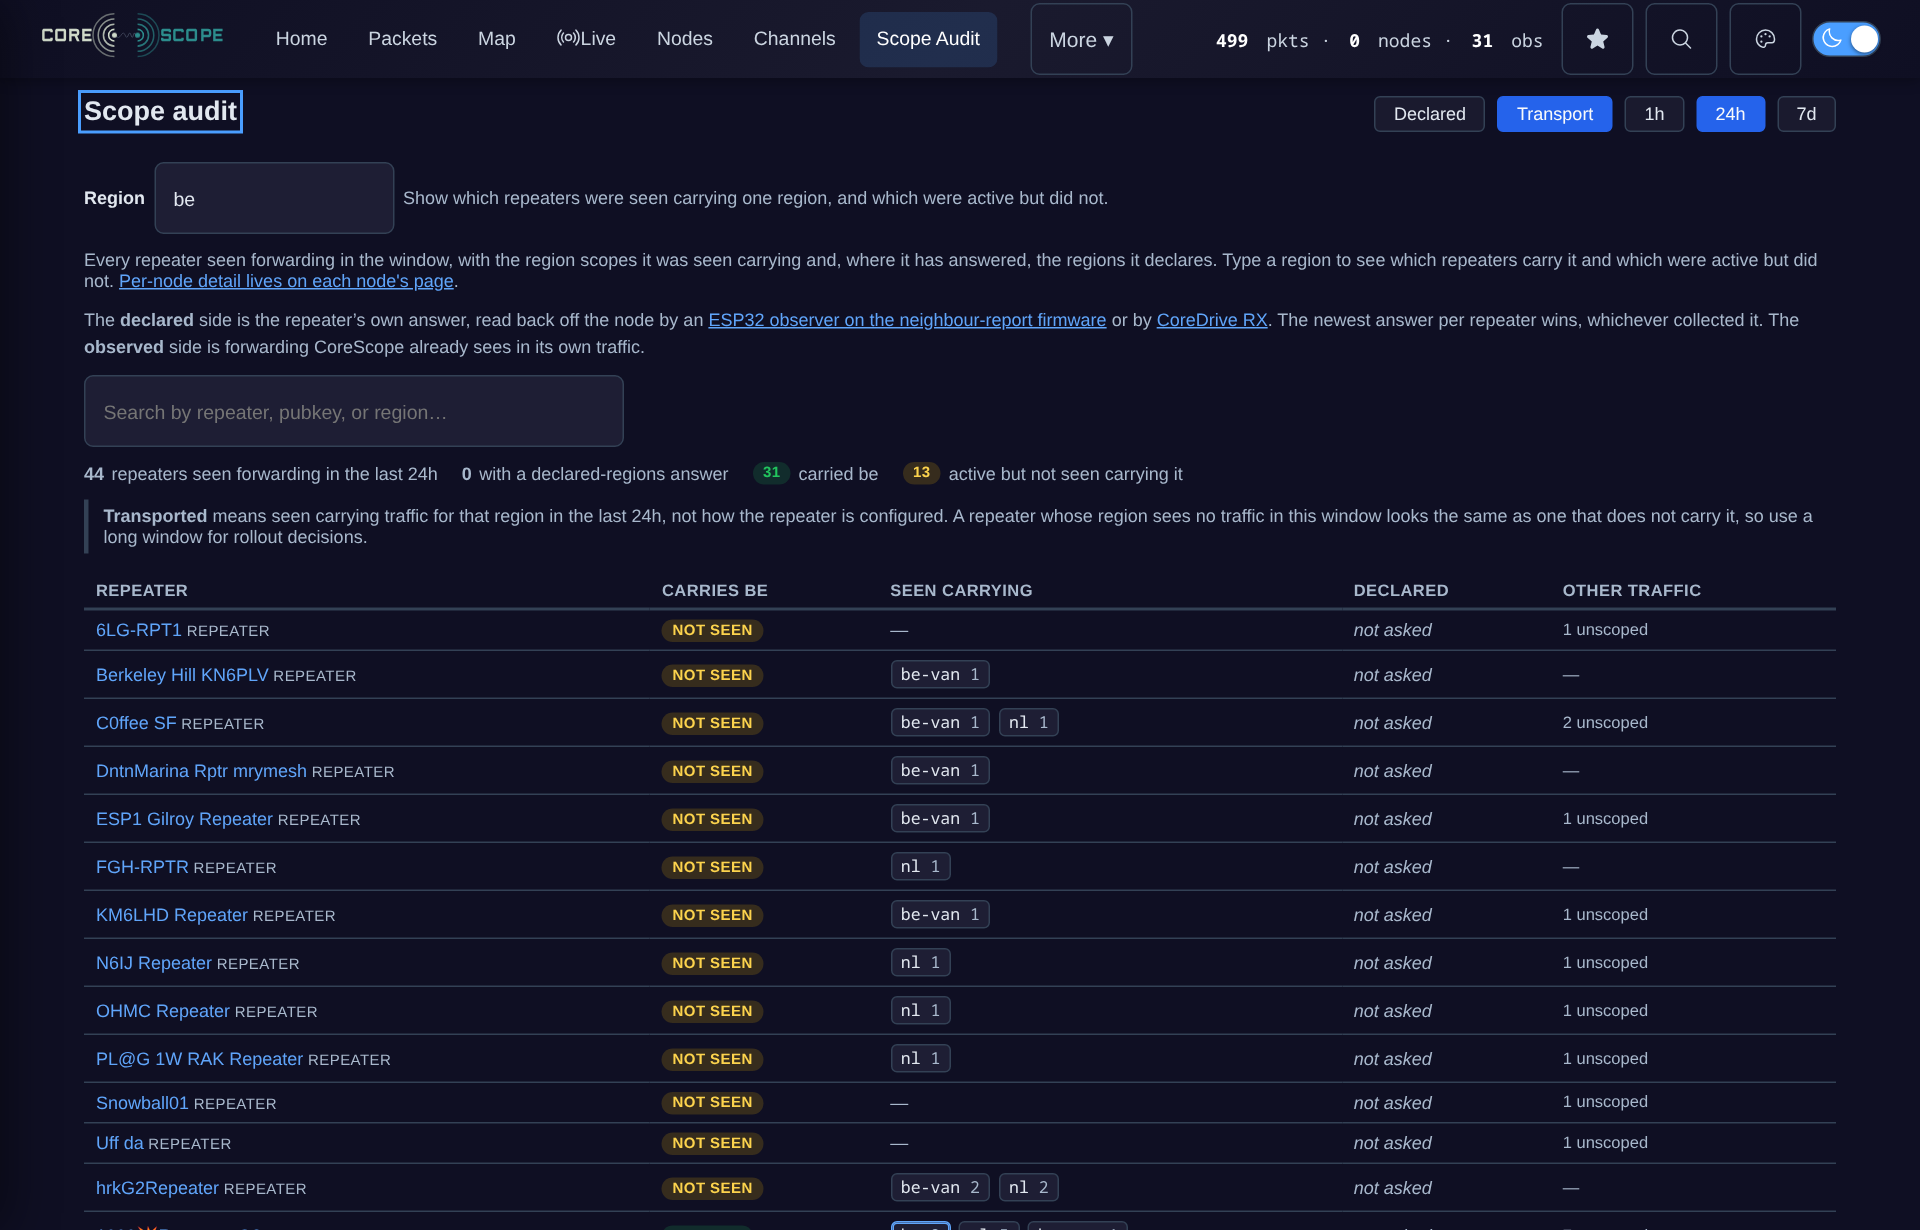 ## Browser validation (staging, real data) Headless Chromium against a staging copy of a production database with its live feed: - `#/scope-audit?window=24h`: the declared view, 16 rows, as before. - Clicking **Transport**: 385 rows; the hash gains `mode=transport`. - Typing a scope as `#XX-YY` in capitals: normalised to `xx-yy`; the hash gains it (now `scope=xx-yy`); summary "385 repeaters seen forwarding in the last 24h · 16 with a declared-regions answer · 51 carried xx-yy · 334 active but not seen carrying it"; the first rows are the non-carriers. - Reloading that hash restores view and region. Switching back to Declared hides the Region box and restores the declared intro. No page errors. - Checked at 1280 px and 390 px wide. Two layout bugs found this way were fixed before opening: the region box inherited `width: 100%` from `.nodes-search`, and `display: flex` overrode the `hidden` attribute on the region bar. ## Tests `tests/unit/test-frontend-helpers.js` gains 10 cases on rendered markup and state, using the page's exported internals like the existing scope-audit tests: hash and API paths (and that a region never leaks into the declared view's link), region normalisation (`#`, capitals, empty), *not asked* vs declared chips (with the `*` wildcard), carried-scope chips with counts and the filtered region marked, the carries column only with a region, HTML escaping of names, the summary counts, region suggestions, and the per-view intro. 768 passing in that file. Net-new UI surface, so per TDD.md the tests land in this PR rather than as a preceding red commit. Frontend suites on this branch: 193 of 194; the one failure, `test-issue-1956-release-routing.js`, needs CI's `GITHUB_REF_NAME` and fails identically on `master` locally (Kpa-clawbot#2149 and Kpa-clawbot#2160 address that). ## Review notes - Colours only through existing CSS variables (no hex literals); the filtered region is marked with the link colour, not a new status colour. - The window note's wording is in the same spirit as the declared view's `windowHonestyNote`. - No API calls per row: one request per view/window/region, cached client-side for 30 s like the declared view. ## SonarLint SonarQube Community rules (the SonarLint engine) were run on the files this PR touches, and only issues on lines it adds are listed. - **Fixed** in `df53e770`: - one `modeQuery` helper for the page hash and the API path (S3358; the two copies were identical); - the carries-scope cell built before the row (S3358); - `localeCompare` for the region suggestions (S2871), `for…of` and `.dataset` (S4138, S7761), optional chaining (S6582); - object spread in the helper tests (S6661). - Optional chaining and spread are already used throughout `public/`. No behaviour change. ## Checked against the repo rules - Rebased onto `master` (`673442cc`). Each red commit was re-run and still fails on its assertions; each green commit passes (TDD.md). - `make test`: all 16 modules pass. Frontend suites: all pass except `test-issue-1956-release-routing.js`, which needs CI's `GITHUB_REF_NAME` and fails the same way on `master` locally (Kpa-clawbot#2160 addresses it). - No private data: test fixtures and examples use the codes the existing tests use (SJC/SFO/LAX, `#be`-style scopes). - No new `map[string]interface{}`, no hard-coded colours. `git add` was explicit, and there is one logical change per commit. 🤖 Generated with [Claude Code](https://claude.com/claude-code) https://claude.ai/code/session_01KaR4xu8gVykQBkH8yG8m6H --------- Co-authored-by: Claude Opus 5.5 <noreply@anthropic.com>
…hange (Kpa-clawbot#2168)

## Summary

`RegionFilter.setSelected()` saved the selection and redrew the control
but never ran the `onChange` listeners; only a click (`toggleRegion`)
did. A programmatic selection therefore updated the dropdown while the
page kept showing data for the old selection until the next click.

Affected today: the Packets page applies a `?region=` URL parameter
through `setSelected`. It registers its listener afterwards, so its
first load is fine, but any other page's listener that is still
registered sees nothing. And anything that offers one-click region
groups has to wrap `setSelected` to make it re-query (an nginx-injected
overlay on one deployment does exactly that). This PR stands alone;
Kpa-clawbot#2170 (configurable quick picks) does not need it.

`setSelected` now compares the new selection with the current one
(order-insensitive; empty and null both mean "all") and, only when they
differ, runs the listeners after saving and re-rendering, exactly as a
click does. Re-applying the current selection stays silent, so a caller
restoring state does not trigger a reload.

No existing issue covers this.

## Tests

- Red commit `75569b78`: `tests/unit/test-region-filter-setselected.js`
loads the real `public/region-filter.js` in a `vm` sandbox. Two cases
fail on `master` (a programmatic selection notifies once with the new
codes; a clear notifies once with `null`). Two pass on both commits on
purpose: re-applying the current selection in another order, and
clearing an empty selection, must not notify.
- Green commit `8a7ddfe1`: the fix.
- Listed in `test-all.sh` in sorted order; `test-test-inventory.js`
passes. `test-1108-region-hide-nodes.js` (the other region-filter suite)
passes. Frontend suites: 194 of 195; the one failure,
`test-issue-1956-release-routing.js`, needs CI's `GITHUB_REF_NAME` and
fails the same way on `master` locally.

## Review notes

- `packets.js` "clear all filters" calls `setSelected([])` and then
reloads itself. When a region was selected, that path now also triggers
the page's region listener, so the packets list is requested twice. It
is a cosmetic double fetch on an explicit user action; left as is to
keep this PR to the component.
- No performance claim; this is a correctness fix.

## SonarLint

SonarQube Community rules (the SonarLint engine) were run on the files
this PR touches, and only issues on lines it adds are listed.

- **Fixed** in `9e732706`: `node:` specifiers (S7772).
- **Kept on purpose:** S1523 on `vm.runInContext`, which loads the
repo's own `public/region-filter.js` as the other frontend unit tests
do.

## Checked against the repo rules

- Rebased onto `master` (`673442cc`). Each red commit was re-run and
still fails on its assertions; each green commit passes (TDD.md).
- `make test`: all 16 modules pass. Frontend suites: all pass except
`test-issue-1956-release-routing.js`, which needs CI's `GITHUB_REF_NAME`
and fails the same way on `master` locally (Kpa-clawbot#2160 addresses it).
- No private data: test fixtures and examples use the codes the existing
tests use (SJC/SFO/LAX, `#be`-style scopes).
- No new `map[string]interface{}`, no hard-coded colours. `git add` was
explicit, and there is one logical change per commit.

🤖 Generated with [Claude Code](https://claude.com/claude-code)

https://claude.ai/code/session_01KaR4xu8gVykQBkH8yG8m6H

---------

Co-authored-by: Claude Opus 5.5 <noreply@anthropic.com>
## Summary **Independent of every other open PR.** Choosing a pick saves the selection, redraws the control and notifies the page's listeners itself, exactly as a click in the control does, so it re-queries straight away whether or not Kpa-clawbot#2168 (`setSelected` notifies) is merged; with both in, nothing fires twice. Region quick picks are named groups of region (IATA) codes, offered as one-tap choices inside the region filter, e.g. "Northern California" for a dozen airport codes instead of ticking each box. One deployment has been injecting these into the page through an nginx `sub_filter` and a script that wraps `window.RegionFilter`; this makes them a configured feature. ```jsonc "regionQuickPicks": [ { "name": "Northern California", "description": "Bay Area and Sacramento observers.", "regions": ["SJC", "SFO", "OAK", "SMF"] } ] ``` - **Server:** `GET /api/config/region-quick-picks` returns the groups cleaned up: names and codes trimmed, codes upper-cased and de-duplicated in their configured order, groups without a name or codes dropped, at most 20 groups of 200 codes, always a list. `/api/config/regions` is unchanged. - **Region filter:** loads the groups with the regions and offers every group with at least one observer today, inside the region control: - dropdown layout: rows of the same kind as **All** (checkbox and bold name), directly under All with a divider before the single regions; the row is ticked while that pick is the selection, ticking it selects the pick and closes the menu, unticking goes back to all; - pill layout: the picks lead the same bar, set off from the single regions by a thin divider. - A tap selects the group's codes that have an observer and re-queries straight away. - The selector then reads the group's name ("South Bay ▾") instead of "2 Regions", and the button shows as pressed. Selecting the same codes by hand does the same. - Tapping the active group again goes back to all regions. - A failed fetch, or no configured groups, leaves the filter exactly as before. - **Mobile:** the rows take the menu's 44 px row height under `(pointer: coarse)`; the pill-bar picks reuse `.region-pill` and its touch target. Inside `.filter-bar` (Packets) the existing touch rule for inputs made every region checkbox a 44 px square; the checkbox is now 20 px and the 44 px row is the tap target. - **Semantics:** like every region filter, a group means "heard by observers in these regions", not "located there"; `config.example.json` says so. No existing issue covers this. ## Screenshot Nodes page with two picks configured (example config below), after tapping **South Bay**: the pick and its codes (SJC, MRY) are selected, and the list re-queried for them. Taken against `test-fixtures/e2e-fixture.db`. 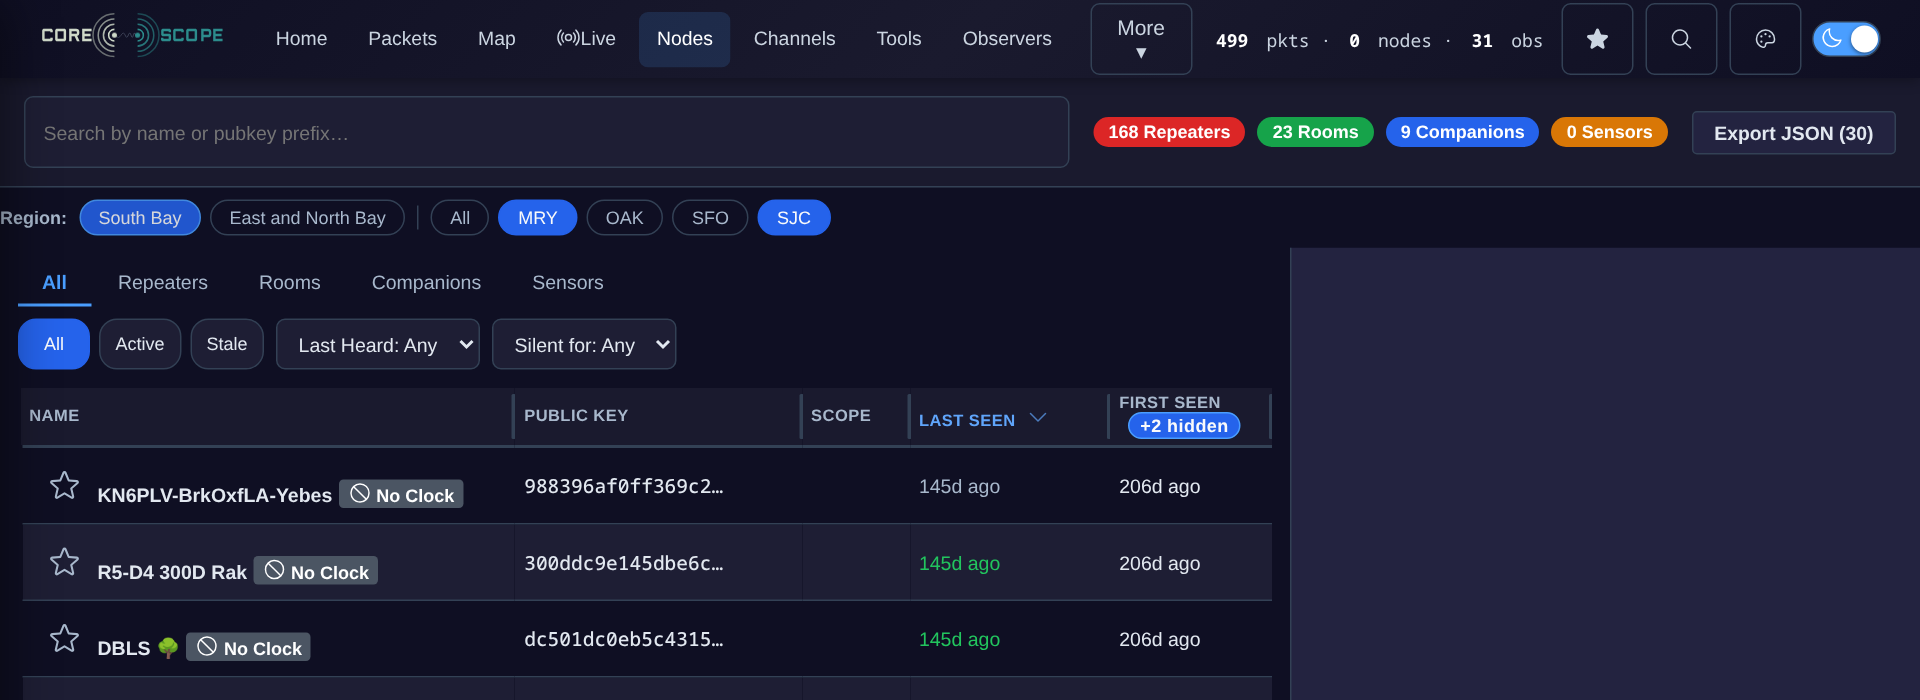 ## Config example ```json "regionQuickPicks": [ { "name": "South Bay", "description": "San Jose and Monterey observers", "regions": ["SJC", "MRY"] }, { "name": "East and North Bay", "description": "Oakland and San Francisco observers", "regions": ["OAK", "SFO"] } ] ``` Each pick needs a `name` and at least one code; `description` is optional (shown as the tooltip). Codes are trimmed, upper-cased and de-duplicated; a pick with no code that has an observer today is not shown. At most 20 picks of 200 codes. ## Browser validation The branch's server was run locally against a migrated copy of `test-fixtures/e2e-fixture.db` (observers in MRY, OAK, SFO, SJC) with three groups configured: "South Bay" (SJC, MRY, SCZ), "East and North Bay" (OAK, SFO, sts) and "Nowhere yet" (XXX). Checked in headless Chromium: | check | desktop 1280 px | phone 390 px (touch) | |---|---|---| | groups shown | South Bay, East and North Bay ("Nowhere yet" hidden) | same | | tap South Bay selects | SJC, MRY (SCZ has no observer) | same | | next `/api/packets` request | `region=SJC,MRY` | `region=SJC,MRY` | | selector label | "South Bay ▾" | "South Bay ▾" | | second tap | back to all regions | same | | button height | 24 px | 44 px | | page wider than viewport | no | no | | page errors | none | none | Checked on Packets (dropdown layout) and Nodes (pill layout). Three layout problems found this way on the phone were fixed before opening: a sideways-scrolling row clipped at the screen edge, the selector squeezed into a narrow column (the filter group is a non-wrapping flex row), and the two wrapped rows spread apart on Nodes (`align-content`). **Revision 1:** the first version put the picks in a separate row beside the selector; they moved inside the dropdown. Re-checked with a 14-region list and three picks on Packets: desktop 1280 px dark and phone 390 px light both keep the menu on screen (menu 340 px wide, page not wider than the viewport), the pick closes the menu and the trigger names the pick. **Revision 2:** picks are checkbox rows like **All** instead of chips. Re-checked on Packets at 1280 px dark and 390 px light: rows render bold under All, the divider separates the single regions, ticking a pick ticks its codes and names the trigger, no sideways scroll. Unrelated and not changed: on Nodes at 390 px the region row (existing pills included) starts flush with the screen edge. ## Tests - Red commit `81ea67d6`: the config type, a stub normaliser and endpoint returning nothing, and tests. - Go: cleaning (trim, upper-case, de-duplicate, drop incomplete groups), caps, nil config, and the endpoint's JSON. - Frontend, `tests/e2e/test-region-quick-picks.js` (moved from `tests/unit/` in `fced69a7`; it needs jsdom, so it runs in the E2E job like `test-table-sort.js`): the real `region-filter.js` in **jsdom** against faked config endpoints. Nine cases: rendering and hiding groups with no observer, selecting and re-querying, the selector label, toggling back, a hand-made selection marked active, the pill layout, no groups, a failed fetch, HTML escaping. Seven fail on the stub, all on assertions. - Green commit `0e33210e`: the implementation, styles, `config.example.json` (`regionQuickPicks` + `_comment_regionQuickPicks`), `docs/api-spec.md`, and the OpenAPI route list (`TestOpenAPICompleteness` requires it). The jsdom test also had a cross-realm comparison bug fixed in this commit (`Array.from` on arrays coming out of the jsdom window). - `make test`: 16 of 16 modules pass. Frontend suites: 195 of 196; the one failure, `test-issue-1956-release-routing.js`, needs CI's `GITHUB_REF_NAME` and fails the same way on `master` locally. - Red commit `f991060d` (revision): picks live inside the dropdown menu before the checkboxes, choosing one closes the menu, and in the pill layout they share the region bar; two fail on assertions against the old layout. Green commit `1f720e35`. Frontend 195 of 196 (same environment-only failure). - Red `134f5256` / green `da0adb50` (second revision): picks are checkbox rows between All and the single regions with a divider, no chips in the menu; ticking and unticking a pick row. The green commit also repairs `style.css`: `1f720e35` had prepended its block to the top of the file (its edit matched an earlier `.region-pill {`) and left the previous rules in place. The file now differs from `master` by 13 lines. ## Review notes - Groups are offered only when at least one of their codes appears in `/api/config/regions`, and only those codes are selected. The stored selection is pruned to known codes on load anyway, so selecting absent codes would not survive a reload. - Customizer (AGENTS.md rule 8): groups are operator configuration; a customizer editor could come later. ## SonarLint SonarQube Community rules (the SonarLint engine) were run on the files this PR touches, and only issues on lines it adds are listed. - **Fixed** in `b84ace4e`: - `normalizeQuickPickCodes` split out of the config normaliser (S3776, 17 > 15); - a comment on why a failed quick-pick fetch is ignored (S2486); - `for…of` in `activePick` (S4138); - in the tests: `node:` specifiers, `includes()`, and an explicit string comparator for sorted selections (S7772, S7765, S2871). - **Kept on purpose:** - S2486 is still reported on that `catch`. Swallowing the error is the intended behaviour: the filter works as before, just without picks. - S1523 on the `vm` test loader, as above. ## Checked against the repo rules - Rebased onto `master` (`673442cc`). Each red commit was re-run and still fails on its assertions; each green commit passes (TDD.md). - `make test`: all 16 modules pass. Frontend suites: all pass except `test-issue-1956-release-routing.js`, which needs CI's `GITHUB_REF_NAME` and fails the same way on `master` locally (Kpa-clawbot#2160 addresses it). - No private data: test fixtures and examples use the codes the existing tests use (SJC/SFO/LAX, `#be`-style scopes). - No new `map[string]interface{}`, no hard-coded colours. `git add` was explicit, and there is one logical change per commit. 🤖 Generated with [Claude Code](https://claude.com/claude-code) https://claude.ai/code/session_01KaR4xu8gVykQBkH8yG8m6H --------- Co-authored-by: Claude Opus 5.5 <noreply@anthropic.com>
Areas are optional
Minimal config: "data": { "enabled": true, "days": 7 }Checked: 🤖 Generated with Claude Code |
A new internal package that places a position in a named area drawn in a
GeoJSON file: Polygon and MultiPolygon with holes, [lon, lat] order, a
layer per feature, the smallest area of a layer winning where areas
overlap, airport codes for observers without a position, and unique codes
across layers. Stubs only; every test fails on its assertions.

Co-Authored-By: Claude Opus 5.5 <noreply@anthropic.com>
Claude-Session: https://claude.ai/code/session_01KaR4xu8gVykQBkH8yG8m6H
ParseGeoJSON reads a FeatureCollection (Polygon and MultiPolygon, holes
respected, [lon, lat] order); each feature's properties give its code,
label, layer (default "region") and the airport codes of observers that
report no position. New refuses a code used twice, in any layer.

Locate checks each polygon's bounding box first, then the even-odd test on
its outer ring and holes, and returns the smallest containing area of the
layer, so nested areas resolve to the most specific. Size is the shoelace
area with longitude scaled by latitude: enough to order overlaps.

BenchmarkLocate (six areas of 2,000 vertices): 2.1 us/op, 0 allocs.

Co-Authored-By: Claude Opus 5.5 <noreply@anthropic.com>
Claude-Session: https://claude.ai/code/session_01KaR4xu8gVykQBkH8yG8m6H
areasFile names a GeoJSON FeatureCollection next to config.json. Its areas
join config.json's (converted from their [lat, lon] order) in one map kept
on the config; a code in both, a missing file or bad JSON are refused.
/api/config/areas lists file areas with their layer, and area= accepts a
file area's code. Stubs only: the tests fail on their assertions.

Also wires internal/areamap into the server module and the Dockerfile, and
adds Map.Has to the package (red there too).

Co-Authored-By: Claude Opus 5.5 <noreply@anthropic.com>
Claude-Session: https://claude.ai/code/session_01KaR4xu8gVykQBkH8yG8m6H
config.json's areas are one polygon or box each, which cannot hold a
coastline, islands or a hole. areasFile names a GeoJSON FeatureCollection
beside config.json whose features become areas too: Polygon and
MultiPolygon with holes, a layer per feature, airport codes for observers
that report no position.

- LoadAreaMap builds one map from config.json's areas (layer "region",
  converted from their [lat, lon] order) and the file, and keeps it on the
  config. A code in both, a missing file or bad GeoJSON stops startup with
  the reason, rather than running with areas silently missing.
- /api/config/areas lists file areas after config.json's, each entry now
  carrying its layer ("region" for config.json areas). Additive: existing
  fields unchanged.
- area= accepts a file area's code, matched by node position against its
  geometry through the same cache. config.json areas keep their existing
  polygon and box path unchanged.

Documented in config.example.json (areasFile + _comment_areasFile),
docs/api-spec.md, and an example file, docs/examples/areas.example.geojson,
which a test loads.

Co-Authored-By: Claude Opus 5.5 <noreply@anthropic.com>
Claude-Session: https://claude.ai/code/session_01KaR4xu8gVykQBkH8yG8m6H
Ports the meshcore.scotmesh.net peering rules to a generic package placed by
areamap areas: advert position, the sender's node record, the first relay of
2 bytes or more (a shared prefix only when every holder agrees), the zero-hop
observer, otherwise unknown. Stub returns zero values so every test fails on
its assertions.

Co-Authored-By: Claude Opus 5.5 <noreply@anthropic.com>
Claude-Session: https://claude.ai/code/session_01KaR4xu8gVykQBkH8yG8m6H
Generic port of the meshcore.scotmesh.net peering rules, placed by areamap
areas in one layer:

- origin: advert position, else the sender's node record, else the majority
  first relay of 2 bytes or more (a shared prefix only when every placed
  holder stands in one area), else the zero-hop observer's area, else unknown
- heard: one entry per receiving area with distinct observers, relayed in by
  its own repeater or heard straight across, the relay it came from, and an
  optional home-area boundary relay (gate)
- via: every area whose placeable repeaters passed it on

Lookups lower-case into a stack buffer and per-packet state lives in fixed
arrays, so Derive allocates only the record's two slices:
BenchmarkDerive 1.1 µs/op, 224 B/op, 2 allocs/op.

Co-Authored-By: Claude Opus 5.5 <noreply@anthropic.com>
Claude-Session: https://claude.ai/code/session_01KaR4xu8gVykQBkH8yG8m6H
Cube totals, packet lists that add up to their figure, summary matrix and
flows, generic scope classes, tail replace and head prune, coverage, and a
pointer-free row of at most 56 bytes. Stub returns zero values.

Co-Authored-By: Claude Opus 5.5 <noreply@anthropic.com>
Claude-Session: https://claude.ai/code/session_01KaR4xu8gVykQBkH8yG8m6H
One 56-byte, pointer-free row per packet per receiving area; strings held
once in a side table, hashes as uint64. Answers from memory:

- Cube: counts per time bucket along origin, heard, type, scope, how,
  route, through and channel, in the row shape the meshcore peering page
  reads, so its explorer ports unchanged
- Summary: totals, bases, matrix overall and per packet kind, flows between
  areas with the relays observers heard them from and home boundary relays
- Packets: the rows behind any figure under the same filters, newest first,
  capped at 2,000 with the full total

Scopes classify generically (direct, unscoped, unrecognised, scoped) so no
deployment's tree is built in. Replace swaps a recent stretch for its
re-derivation; Prune drops the head.

Worst case, 120k rows each with a distinct key: 7-day cube 64 ms; replacing
30 minutes (300 packets) 0.7 ms.

Co-Authored-By: Claude Opus 5.5 <noreply@anthropic.com>
Claude-Session: https://claude.ai/code/session_01KaR4xu8gVykQBkH8yG8m6H
Fills from SQLite (v3 schema, scope_name), places packets with the areas
file, names relays from the node table, re-derives the recent stretch to
pick up late observations, and serves config, summary, cube and packets
(404 while off, 400 for a window past the index or a bad filter). The
config defaults to 7 days, capped at 30. Stub service and handlers.

Co-Authored-By: Claude Opus 5.5 <noreply@anthropic.com>
Claude-Session: https://claude.ai/code/session_01KaR4xu8gVykQBkH8yG8m6H
With data.enabled and areas configured, the server keeps a dataindex of
the last data.days days (default 7, at most 30):

- startup fill straight from SQLite, read-only, newest 2,000-id chunk
  first, so recent periods answer within seconds; coverage reported while
  it runs
- every 2 minutes the last 30 minutes are re-derived (late observations)
  and aged rows pruned; node positions re-read every 30 minutes; a full
  rebuild once a day
- GET /api/data/config, /summary, /cube (cached 60 s, one build at a
  time per window), /packets (filters validated, two at a time)

Off by default; enabled with no areas, an empty layer or an unknown
homeArea stops startup with the reason. Documented in config.example.json,
docs/api-spec.md and the OpenAPI spec (new data tag).

Co-Authored-By: Claude Opus 5.5 <noreply@anthropic.com>
Claude-Session: https://claude.ai/code/session_01KaR4xu8gVykQBkH8yG8m6H
A full-height workspace over /api/data: a pinned period bar for the whole
page; a rail where the question is built (stackable filter chips with
is / is not and per-value counts, presets, chart type, count or share, X
axis time or any dimension, time grouping, split by, separate charts by,
picked-out series); and the answer beside it (headline tiles, the chart
with hover tooltips, legend with counts, relay tables when one start and
one receiving area are pinned, the numbers in a table, and the
who-hears-whom matrix, every cell and heading clickable).

Any bar, segment, line point or row opens the packets behind it in a
modal with addable, sortable columns; a row opens CoreScope's own packet
view, and Back returns to the same question because it lives in the
address. Presets and tiles are generic; with data.homeArea set they add
leaving / entering the home area and its boundary relays. Full screen
hides the site navigation; on a phone the presets and chart options fold
under the filters so the chart is on the first screen.

Categorical colours from the dataviz reference palette, validated on
CoreScope's card surfaces in both themes. Names from the areas file and
the mesh are written with textContent. The tab is listed in the top nav,
the drawer and the phone menu, and says so plainly where data.enabled is
off. axe gate: 0 violations on /data (desktop and mobile, both themes).

Co-Authored-By: Claude Opus 5.5 <noreply@anthropic.com>
Claude-Session: https://claude.ai/code/session_01KaR4xu8gVykQBkH8yG8m6H
The ready-made filter sets move from a "Start from" block at the top of
the rail into the Filters block, as a "Preset filters" menu beside
"+ Add filter". Picking one replaces the chips, which then edit like any
others; the rail now opens on the filters themselves.

Co-Authored-By: Claude Opus 5.5 <noreply@anthropic.com>
Claude-Session: https://claude.ai/code/session_01KaR4xu8gVykQBkH8yG8m6H
…a/dashboards

Built-in dashboards first, then the operator's from data.dashboardsFile,
each validated (schema, ids, panel types, dimensions, layout, variables,
limits); a bad file, a clash with a built-in id or an unknown default is
refused. The endpoint serves them with the default and the home area, and
404s while the tab is off. Stub returns nothing.

Co-Authored-By: Claude Opus 5.5 <noreply@anthropic.com>
Claude-Session: https://claude.ai/code/session_01KaR4xu8gVykQBkH8yG8m6H
…boards

Dashboards are schema-1 JSON documents: panels of a query over the cube,
a panel type (bar, line, area, matrix, stat, table, top, text) and a place
on a 12-column grid, plus optional $variables. Two generic built-ins
(Overview; Scopes and channels) need nothing but an areas file. An operator
lists more in data.dashboardsFile, exactly as the tab's Export saves them;
data.defaultDashboard picks the first one shown. Every document is checked
at startup (unknown fields, types or dimensions, ids, layout, limits of 50
dashboards and 24 panels) and a bad file stops startup with the reason.
The server stores nothing; visitors' own dashboards stay in their browser.

Co-Authored-By: Claude Opus 5.5 <noreply@anthropic.com>
Claude-Session: https://claude.ai/code/session_01KaR4xu8gVykQBkH8yG8m6H
A13xB0
added
the
blocked: memory
|
The memory problem is solved; the Data tab is back on in pre-prod. The OOM kills came from the packet store being too big on its own, with the startup fill pushing it over the 1.5 GB container limit. These fork PRs cut both:
Measured on a copy of a week of a busy network:
On pre-prod (
Removing 🤖 Generated with Claude Code |
A13xB0
removed
the
blocked: memory
…h started

The packets page's area filter kept a packet only when it named its
sender, which only adverts do, so every other type vanished as soon as an
area was picked. With the Data tab's index the area is where the packet
started (advert position, first relay, or the observer of an unrelayed
packet); the list and the detail say what that origin was and how it was
decided.

Co-Authored-By: Claude Opus 5.5 <noreply@anthropic.com>
Claude-Session: https://claude.ai/code/session_01KaR4xu8gVykQBkH8yG8m6H
With the Data tab placing packets, area= on /api/packets keeps the packets
that started in the area (its index: advert position, first relay of 2+
bytes, or the observer of an unrelayed packet) instead of only adverts
whose sender stands there. Lists carry origins{hash: {area, basis}} and
the packet detail its origin. Without the index, or for an area it does
not place in, area= behaves as before.

The index answers by one scan of its rows; the result of a list is copied
before origins are added, since the grouped list is cached.

Co-Authored-By: Claude Opus 5.5 <noreply@anthropic.com>
Claude-Session: https://claude.ai/code/session_01KaR4xu8gVykQBkH8yG8m6H
… placed

Co-Authored-By: Claude Opus 5.5 <noreply@anthropic.com>
Claude-Session: https://claude.ai/code/session_01KaR4xu8gVykQBkH8yG8m6H
When /api/packets carries origins, the packets table gets an Origin column
(the starting area's code; how it was decided on hover; … for a packet
newer than the index, — when nothing placed it) and the detail pane an
Origin row. The column sorts, hides from the column menu, and is not
offered at all on servers without areas. Hidden by default on phones,
like Scope.

Co-Authored-By: Claude Opus 5.5 <noreply@anthropic.com>
Claude-Session: https://claude.ai/code/session_01KaR4xu8gVykQBkH8yG8m6H
…laced

Co-Authored-By: Claude Opus 5.5 <noreply@anthropic.com>
Claude-Session: https://claude.ai/code/session_01KaR4xu8gVykQBkH8yG8m6H
Co-Authored-By: Claude Opus 5.5 <noreply@anthropic.com>
Claude-Session: https://claude.ai/code/session_01KaR4xu8gVykQBkH8yG8m6H
Co-Authored-By: Claude Opus 5.5 <noreply@anthropic.com>
Claude-Session: https://claude.ai/code/session_01KaR4xu8gVykQBkH8yG8m6H
Daily share of packets that passed A and reached B, against the range it
usually falls in; hops and routes between them; and route changes day by
day against the week before: a repeater that dropped out (quiet if it
stopped relaying everywhere, else rerouted), one that started carrying
(new if first heard lately, else sharing the load), or the main route
moving. A change stays a flag for a week, then is history.

Co-Authored-By: Claude Opus 5.5 <noreply@anthropic.com>
Claude-Session: https://claude.ai/code/session_01KaR4xu8gVykQBkH8yG8m6H
…hboards

Co-Authored-By: Claude Opus 5.5 <noreply@anthropic.com>
Claude-Session: https://claude.ai/code/session_01KaR4xu8gVykQBkH8yG8m6H
GET /api/data/path follows two repeaters from the packet store's path
index: packets that passed the first, those that then reached the second
(their resolved paths read in batches only for those), the share per 24
hours against its usual range, routes and hops, and route changes in
words. POST /api/data/paths answers up to 24 pairs for a watch list.
Dashboards take 'watch' (query.from/to, keys or $variables) and
'watchlist' (options.watches) panels and a 'repeater' variable kind.
Cached 5 minutes per pair; read-only; 404 when the Data tab is off.

Co-Authored-By: Claude Opus 5.5 <noreply@anthropic.com>
Claude-Session: https://claude.ai/code/session_01KaR4xu8gVykQBkH8yG8m6H
…ing a watch

Co-Authored-By: Claude Opus 5.5 <noreply@anthropic.com>
Claude-Session: https://claude.ai/code/session_01KaR4xu8gVykQBkH8yG8m6H
A 'watch' panel follows two repeaters (keys or repeater $variables): the
share that got through in the last 24 hours against its usual range, how
many made it, hops, the main route, the daily share as dated bars over a
band, the routes taken and the route history in words. A 'watch list'
shows several pairs one line each (both ways when asked), tagged with a
route change or a share outside its range, in one request; a line opens
the full watch. '+ Add watch' picks two repeaters by name, warns when
nothing has passed between them, and saves to your copy of a dashboard.
Repeater variables get a picker. Dashboards of watches load no cube.

Co-Authored-By: Claude Opus 5.5 <noreply@anthropic.com>
Claude-Session: https://claude.ai/code/session_01KaR4xu8gVykQBkH8yG8m6H
Co-Authored-By: Claude Opus 5.5 <noreply@anthropic.com>
Claude-Session: https://claude.ai/code/session_01KaR4xu8gVykQBkH8yG8m6H
… pages

Co-Authored-By: Claude Opus 5.5 <noreply@anthropic.com>
Claude-Session: https://claude.ai/code/session_01KaR4xu8gVykQBkH8yG8m6H
…share says so

Co-Authored-By: Claude Opus 5.5 <noreply@anthropic.com>
Claude-Session: https://claude.ai/code/session_01KaR4xu8gVykQBkH8yG8m6H
…g share says so

On pre-prod a path with 16 crossings a day raised five 'rerouted' changes
in two days from a handful of packets. A repeater dropping out now needs
at least 10 packets expected through it that day, one joining 10 packets
through it, and a main-route change 30 crossings that day and in the week
before. When the main route stays the same but its share moves, the
change is 'route-share' and says so instead of naming the route twice.

Co-Authored-By: Claude Opus 5.5 <noreply@anthropic.com>
Claude-Session: https://claude.ai/code/session_01KaR4xu8gVykQBkH8yG8m6H
Co-Authored-By: Claude Opus 5.5 <noreply@anthropic.com>
Claude-Session: https://claude.ai/code/session_01KaR4xu8gVykQBkH8yG8m6H
On pre-prod Keir Hill's outage showed twice on the North link: 'rerouted'
on 7 Oct (it had relayed elsewhere earlier in that 24 hours) and 'quiet'
two days later. The later evidence now upgrades the first entry instead.

Co-Authored-By: Claude Opus 5.5 <noreply@anthropic.com>
Claude-Session: https://claude.ai/code/session_01KaR4xu8gVykQBkH8yG8m6H
Co-Authored-By: Claude Opus 5.5 <noreply@anthropic.com>
Claude-Session: https://claude.ai/code/session_01KaR4xu8gVykQBkH8yG8m6H
FlagDays sets how long a change stays a flag (e.g. 14), and changes are
looked for that far back even when fewer days are shown. Changes are also
found a week further back than reported, so one already under way then is
recognised as old instead of being reported again.

Co-Authored-By: Claude Opus 5.5 <noreply@anthropic.com>
Claude-Session: https://claude.ai/code/session_01KaR4xu8gVykQBkH8yG8m6H
…store; flagDays

Co-Authored-By: Claude Opus 5.5 <noreply@anthropic.com>
Claude-Session: https://claude.ai/code/session_01KaR4xu8gVykQBkH8yG8m6H
…n, flags up to 3 weeks

The path watch read the packet store, which on pre-prod holds 7 days:
too short for a fortnight's flags (each change needs the week before it),
so flags fell away and changes were judged against part of a week. It
also only looked at each packet's longest observation, which missed most
crossings on side routes (Angus to Fife 0.3% against 14% on every
observation; Galloway to Ayr 3% against 27%).

It now keeps its own history (data.pathDays, default 21, at most 45):
each packet's first-heard time and the distinct resolved paths its
observers saw (only the longest: a stretch of another is dropped), with
repeaters numbered in two bytes. Filled after the Data tab's first fill,
topped up every two minutes, rebuilt daily. On the ScotMesh bench: 165,157
packets over 21 days in 12 s, about 50 MB. Panels and the API take
flagDays (7, 14 or 21) for how long a route change stays a flag.

Co-Authored-By: Claude Opus 5.5 <noreply@anthropic.com>
Claude-Session: https://claude.ai/code/session_01KaR4xu8gVykQBkH8yG8m6H
…nge is wide

Co-Authored-By: Claude Opus 5.5 <noreply@anthropic.com>
Claude-Session: https://claude.ai/code/session_01KaR4xu8gVykQBkH8yG8m6H
…wide

Ireland gateway to Ayr read 1% against a usual 55% and called it normal:
its fortnight straddled the drop, so the range reached down to nothing.

Co-Authored-By: Claude Opus 5.5 <noreply@anthropic.com>
Claude-Session: https://claude.ai/code/session_01KaR4xu8gVykQBkH8yG8m6H
Co-Authored-By: Claude Opus 5.5 <noreply@anthropic.com>
Claude-Session: https://claude.ai/code/session_01KaR4xu8gVykQBkH8yG8m6H
Co-Authored-By: Claude Opus 5.5 <noreply@anthropic.com>
Claude-Session: https://claude.ai/code/session_01KaR4xu8gVykQBkH8yG8m6H




This PR adds a Data tab (
#/data): a full-screen workspace covering every packet of the last few days. Each packet is placed by the area it started in (from GPS and node positions, drawn from a GeoJSON areas file), not by which observer heard it, and by every area whose observers heard it. It works with any deployment's areas. It is off unlessdata.enabledis set.Plan: https://claude.ai/artifact/PAJwg4KmQQ7Cp7nSDvyBo9.
This one PR replaces #14 and #15. Each step is its own red/green commit pair, so the steps can be split out again if wanted.
The steps, in commit order
internal/areamappackage.areasFilein config: Polygon or MultiPolygon, holes, layers, smallest area wins,iatafallback, duplicate codes refused. Areas from the file also work in/api/config/areasand the existingarea=filter.internal/originpackage. The start comes from, in order: the advert's GPS, then the sender's node record, then the majority first relay of 2+ bytes (a shared prefix counts only if every holder is in one area), then the zero-hop observer's area, else unknown. For each receiving area it records relayed or across, the relay it was heard from, and the home-area boundary relay.internal/dataindexpackage: one pointer-free 56-byte row per packet per receiving area, with strings interned and hashes stored as uint64. Builds the cube, the summary (matrix, flows, relays) and filtered packet lists, all from memory.dataconfig block and the background fill from SQLite (read-only, newest chunk first). Every 2 min the last 30 min are re-derived; positions are re-read every 30 min; the whole index is rebuilt nightly. AddsGET /api/data/config,/summary,/cubeand/packets, and documents them inopenapi.goanddocs/api-spec.md.public/data.jsanddata.css, plus nav, drawer and phone-menu entries.The tab
data.homeAreaset, the presets and tiles add leaving/entering for the home area and its boundary relays.Tests
scripts/allmod.sh vetandtestpass on all 19 modules, including the full server suite. The Dockerfile COPY invariant check passes, and gofmt is clean.tests/unit/test-data-tab.js(9 tests, jsdom against faked APIs), added totest-all.sh. All frontend suites pass excepttest-issue-1956-release-routing.js, which also fails on master because it needs the CI-onlyGITHUB_REF_NAME./dataadded to the axe gate. Result: 0 violations across desktop and mobile, dark and light.Numbers
origin.DeriveoriginStill to do before merge
scotmesh-preprodwith this branch merged, ScotMesh'sareas.geojson, and a 24 h soak against these limits:Packets page: area means origin
area=on/api/packetskeeps the packets that started in the area, by the same rules as this tab: the advert's position, else the first relay (2+ byte hop), else the observer of an unrelayed packet. Without the index, or for an area it doesn't place in,area=behaves as before.origins: {hash: {area, basis}}and the packet detail anorigin. The packets table gets an Origin column (code; how it was decided on hover;…for packets newer than the index,—when nothing placed it) and the detail pane an Origin row. The column only appears on servers with areas.area=SCOwent from 4.7k packets (adverts only) to 23k of every type. List timings unchanged (0.22–0.33 s).internal/dataindex(StartedIn, OriginsOf), server (data_packet_origin_test.go: filter by origin, origins in list and detail, none without the index), e2etest-packets-origin-e2e.js(6).Notes
rx-coverageis injected) can follow if wanted.Path watch panels
Two new panel types follow the path between two repeaters:
watch: the share of packets that passed the first repeater and reached the second in the last 24 hours, against its usual range; how many made it; hops; the main route; the daily share as dated bars; the routes taken; and a route history in words.watchlist: several pairs, one line each (both ways if asked), tagged when the route changes. A line opens the full watch.repeatervariable kind gets a picker, a built-in Path dashboard works for any pair, and repeater pages link to it with Watch a path.internal/pathwatchdoes the analysis;GET /api/data/pathandPOST /api/data/paths(up to 24 pairs) read the packet store's path index; resolved paths are read in batches, and only for the packets that reached the second repeater;tests/e2e/test-data-watch.js(jsdom, 8 cases).dashboards.json. Six pairs are answered in 1.7 s; Keir Hill's outage on 7 Oct shows as "quiet" on the North link.🤖 Generated with Claude Code
https://claude.ai/code/session_01KaR4xu8gVykQBkH8yG8m6H