Hi,
I am following the tutorial (https://bcm-uga.github.io/lfmm/articles/lfmm) for lfmm analysis. In my analysis, I am using .raw file as genotype and a phenotype file.
Input file: gi.lfmm <- lfmm_ridge(Y=gen.imp, X=pred.PC1, K=K).
Finally, I am using following command to make a Manhattan plot. However, I am not getting how to categories SNPs at different chromosome (total 11). Please advise.
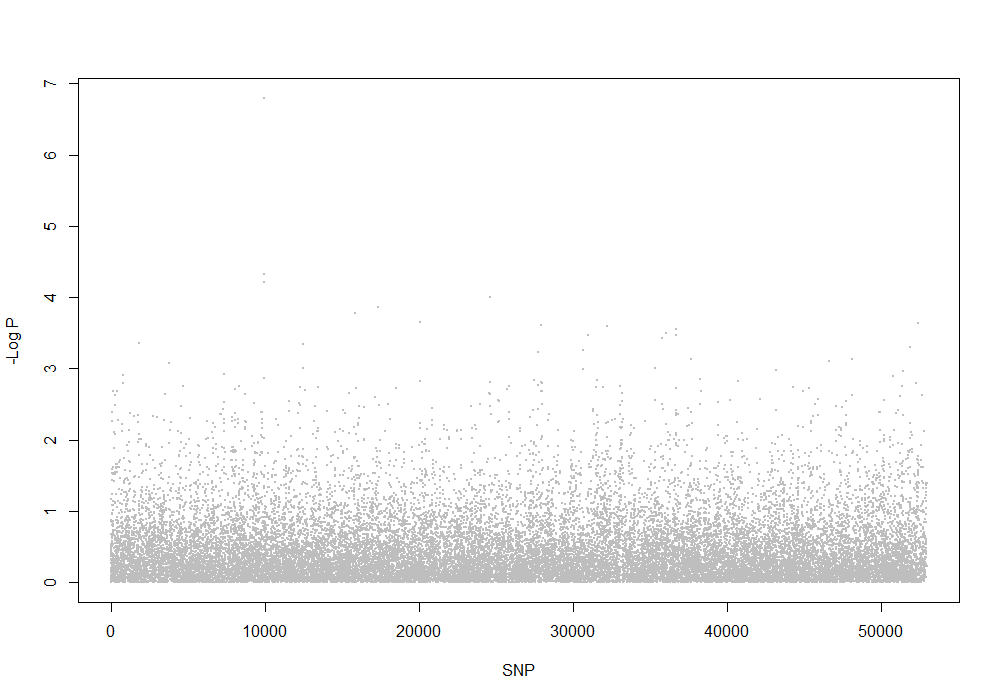
plot(-log10(pvalues),
pch = 19,
cex = .2,
xlab = "SNP", ylab = "-Log P",
col = "grey")
Current result:
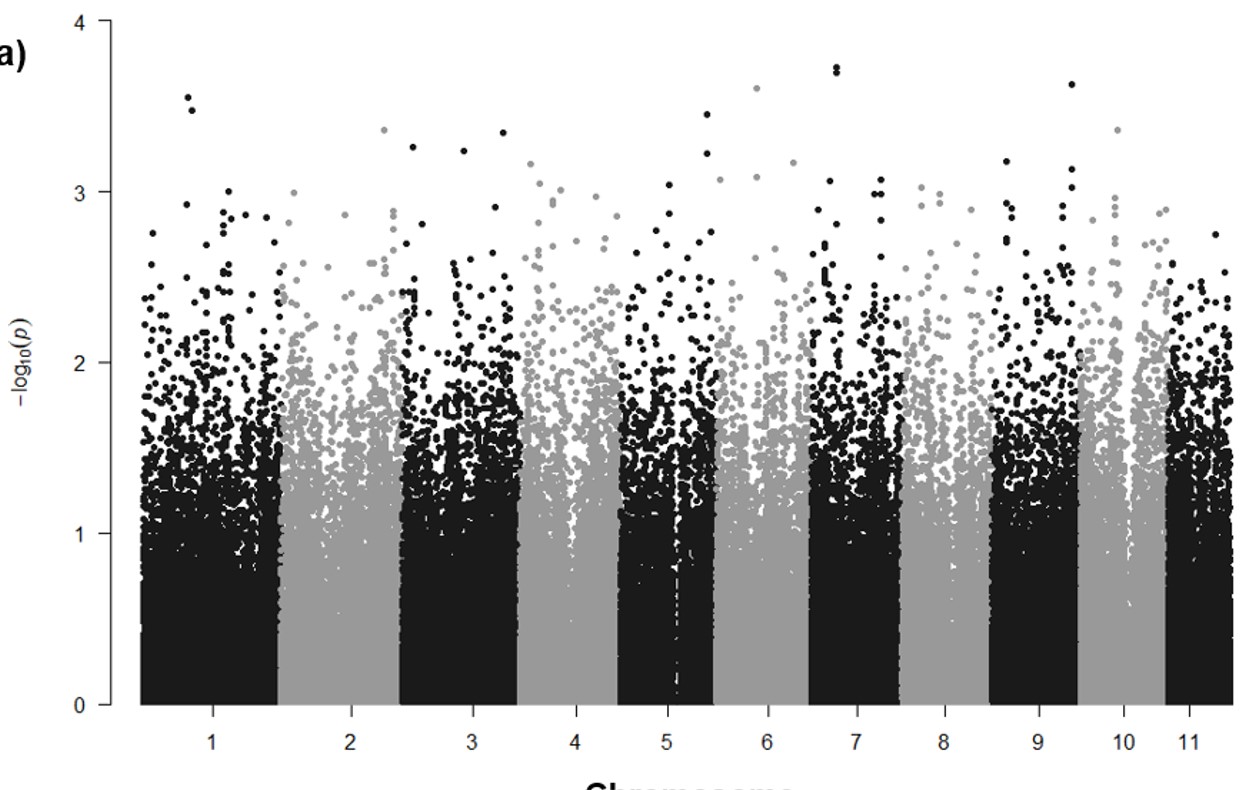
Expected Manhattan Plot:
Hi,
I am following the tutorial (https://bcm-uga.github.io/lfmm/articles/lfmm) for lfmm analysis. In my analysis, I am using .raw file as genotype and a phenotype file.
Input file: gi.lfmm <- lfmm_ridge(Y=gen.imp, X=pred.PC1, K=K).
Finally, I am using following command to make a Manhattan plot. However, I am not getting how to categories SNPs at different chromosome (total 11). Please advise.
plot(-log10(pvalues),

pch = 19,
cex = .2,
xlab = "SNP", ylab = "-Log P",
col = "grey")
Current result:
Expected Manhattan Plot: