Ruby Grant 2019 Final Report
Author: Alish Dipani
Email: alishdipani@gmail.com
Github: alishdipani
- Overview
- Code
- Installation
- Usage
- Results
- Conclusion
- More resources
- Future Work
- Acknowledgements
Rubyplot is a plotting library for Ruby inspired from the library Matplotlib for Python. The aim of creating such a library is to create a platform-independent data visualisation library to be used with Ruby for scientific computing and web development. For this library to have ruby-like behaviour, the front-end is back-end agnostic while having multiple back-ends. The advantage of such an architecture is that it enforces ruby-like behaviour rather than backend-like behaviour while being compatible with multiple platforms.
Currently, Rubyplot supports two back-ends: GR and ImageMagick
The main objectives for Rubyplot are:
- Provide a large variety of good looking plots which can be used for real-world applications.
- Be compatible with multiple backends.
- Provide Image loading, saving and Manipulation functionality for Machine Learning applications.
- Support different types of arrays for Data visualisation and Machine Learning applications.
Main Repository : https://github.com/SciRuby/rubyplot
My Repository : https://github.com/alishdipani/rubyplot
Rubyplot is still in development, and hence the installation has to be done through source.
sudo ln -s <GR path> /usr/local/grGR is usually installed in '/usr/gr/'.
- Clone and install rubyplot:
git clone https://github.com/SciRuby/rubyplot
cd rubyplot
rake compile
gem build rubyplot.gemspec
gem install ./rubyplot-0.1.pre.a1.gem- Set environment variables before using:
export GRDIR="/usr/local/gr"
export GKS_FONTPATH="/usr/local/gr"
# Set Backend, for gr use "GR" and for magick use "MAGICK"
export RUBYPLOT_BACKEND="MAGICK"
These can also be added to .bashrc to avoid declaring them each time.
Rubyplot is a library with which a user can visualise data easily with just a few lines of code while having full control over every aspect of the plot. Images can also be loaded and manipulated easily with just a few lines of code.
Any plot in Rubyplot can be created in 4 easy steps:
- Importing Rubyplot and set up important properties for Rubyplot, i.e. backend, inline show, etc.
- Create a Figure(i.e. Canvas) on which the graphs will be plotted
- Choose the types of graphs and set their properties like data, title, colour, etc.
- Display the graph or save the Figure
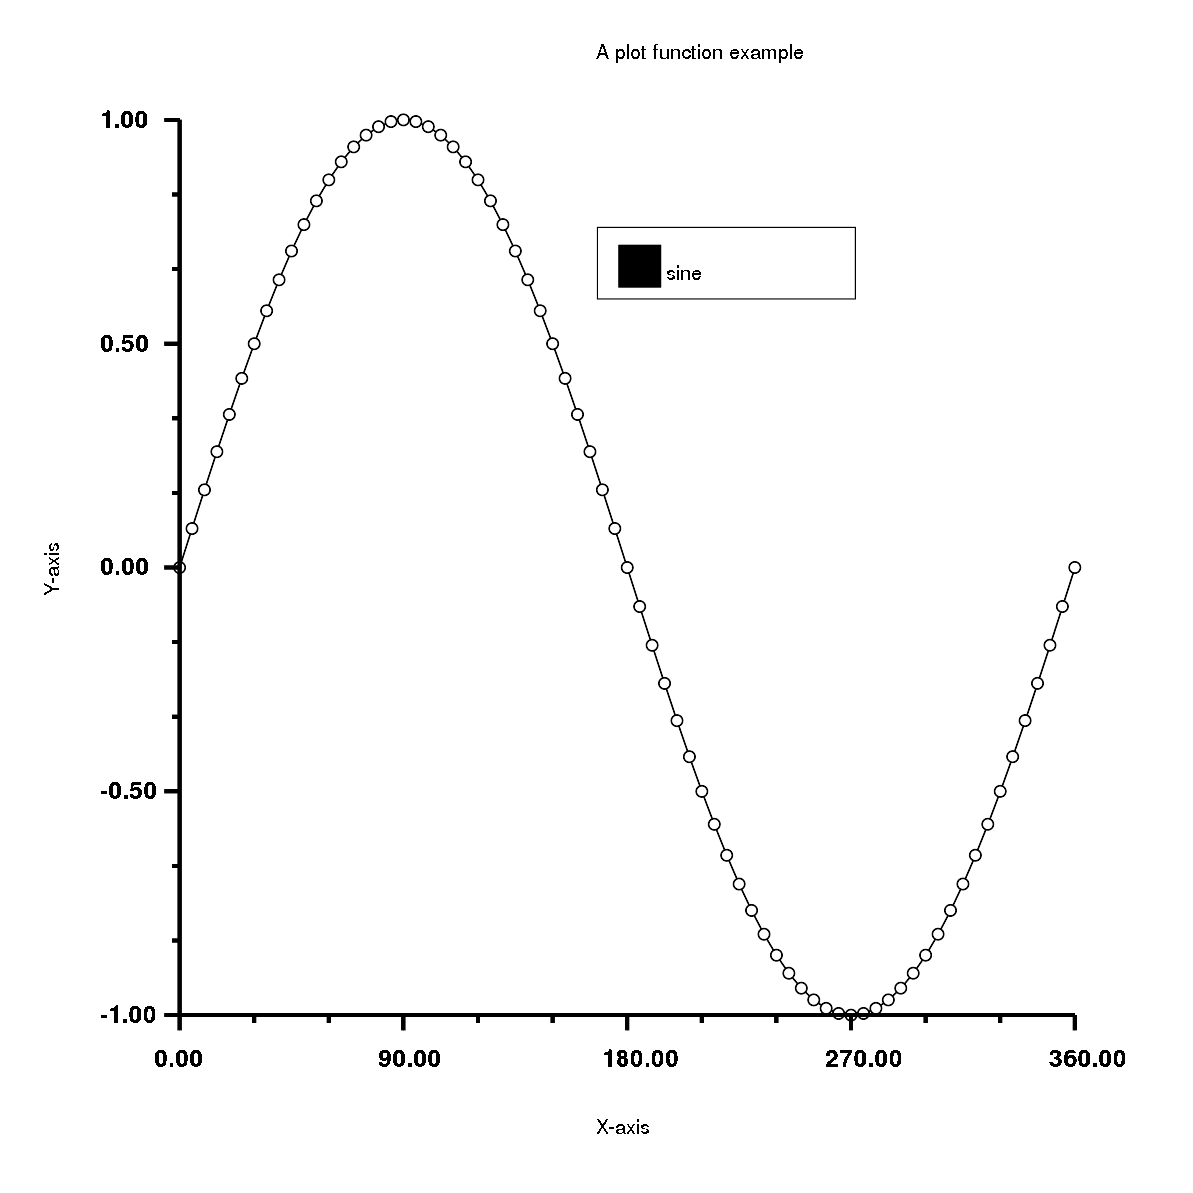
An example of Rubyplot is :
require 'rubyplot'
Rubyplot.set_backend :magick

figure = Rubyplot::Figure.new(width: 30, height: 30)

axes00 = figure.add_subplot! 0,0
axes00.plot! do |p|
  d = (0..360).step(5).to_a
  p.data d, d.map { |a| Math.sin(a * Math::PI / 180) }
  p.fmt = 'ok-'
  p.marker_fill_color = :white
  p.marker_size = 0.5
  p.line_width = 2
  p.label = "sine"
end

axes00.title = "A plot function example"
axes00.square_axes = false

figure.write('example1.png')
The output of the code is:
Tutorial for Rubyplot plotting can be found here
Any Image can be loaded, manipulated and saved in just a few steps, for example, steps for manipulating an image would be:
- Rubyplot is imported, the image is read and stored in a Rubyplot::Image object.
- Pixels are exported from the image.
- Manipulating the pixels.
- A new Rubyplot::Image object is created with specified rows and columns.
- Manipulated pixels are imported to the Rubyplot::Image object.
- Show the new image.
require 'rubyplot' # Import rubyplot
require 'numo/narray' # Importing Numo narray for manipulation

img = Rubyplot::Image.new # Creating a new Image Object
img.imread('paris.jpeg') # Reading an image
img.imshow # Showing the Image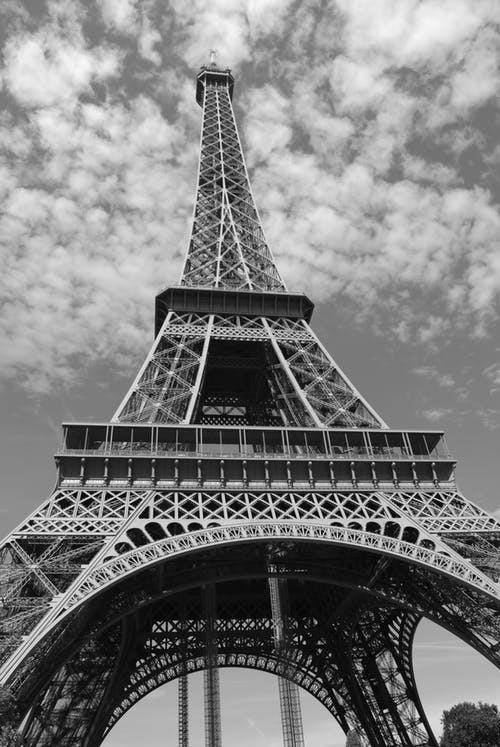
img_pix = img.export_pixels # Exporting pixels from img, map is set as RGB as the image is RGB
img_pix_narray = Numo::DFloat.cast(img_pix) # Casting exported pixel array as a Numo::DFloat array

# Manipulating Numo array
img_pix_narray_new = Numo::DFloat.cast(img_pix_narray>(Rubyplot.QuantumRange/3)) * Rubyplot.QuantumRange
# Choosing pixels which have more intensity than Rubyplot.QuantumRange/3 for each channel
# Intensity of a pixel ranges from 0 to Rubyplot.QuantumRange

img_copy = Rubyplot::Image.new(img.columns,img.rows) # Creating an Image to copy img with number of columns and rows exported
img_copy.import_pixels(img_pix_narray_new) # Importing pixels extracted from img

img_copy.imshow # Showing the copied image
# img_copy.imwrite("paris_copy.jpg") # Image can be written with any format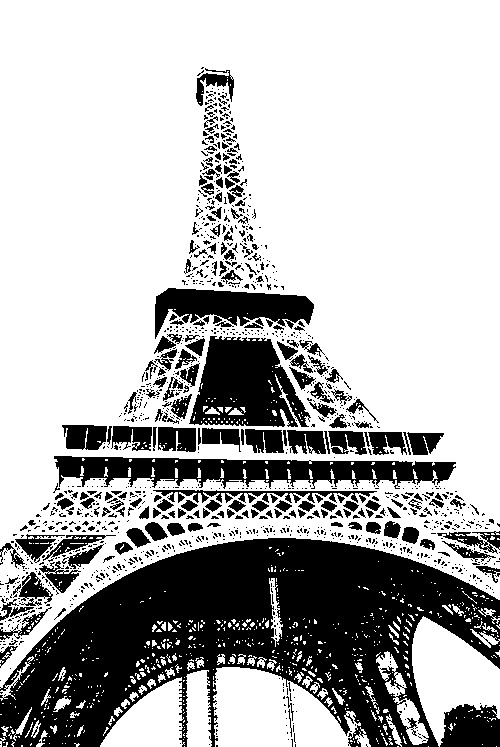
Tutorial for Rubyplot Image can be found here
This work has been done to improve Magick backend and general architecture.
- Improvements in Appearance (Fixed Bugs)
- Added opacity to area plot
- Added width and color options to error bar plot
- Added median width to box plot
- Improvements in ticks
- Improvements in legends
- Added Documentation
- Improved tests
- Every property of every plot is tested
- Added image viewing option to tests
- Added Image class:
- Rubyplot can now load, show and write images
- Images can be converted into other formats
- Pixels can be extracted from images
- Images can be created by providing values for each map (R = red, G = green, B = blue, A = alpha, C = cyan, Y = yellow, M = magenta, K = black, or I = intensity (for grayscale))
- Added a tutorial for Image class
- Pixels can be given as a Ruby Array or Numo array
- Images also support inline plotting in IRuby notebooks
- Added Support for Numo array
- Data can be provided as Numo arrays to Rubyplot
- Pixels can be provided as a Numo Array to Rubyplot
require 'rubyplot' # Import rubyplot

img0 = Rubyplot::Image.new # Creating a new Image Object
img0.imread('mnist0.jpg') # Reading a MNIST Image
img0.imshow # Showing the Image
img0_pix = img0.export_pixels("I") # Exporting pixels from img0, map is set as intensity(I) as the image is grayscale

img0_copy = Rubyplot::Image.new(img0.columns,img0.rows) # Creating an Image to copy img0 with same number of columns and rows
img0_copy.import_pixels(img0_pix,"I") # Importing pixels extracted from img0

img0_copy.imshow # Showing the copied image
# img0_copy.imwrite("mnist0_copy.jpg") # Image can be written with any format
require 'rubyplot' # Import Rubyplot

img1 = Rubyplot::Image.new # Creating a new Image Object
img1.imread('cat.jpg') # Reading an image of a cat
img1.imshow # Showing the Image
img1_pix = img1.export_pixels("RGB",900,50,800,750) # Exporting pixels from img1, map is set as RGB as the image is RGB
# 800x750 pixels are exported from the position (900,50) i.e. offset is (900,50)

img1_copy = Rubyplot::Image.new(800,750) # Creating an Image to copy img1 with number of columns and rows exported
img1_copy.import_pixels(img1_pix) # Importing pixels extracted from img1

img1_copy.imshow # Showing the copied image
# img1_copy.imwrite("cat_copy.jpg") # Image can be written with any format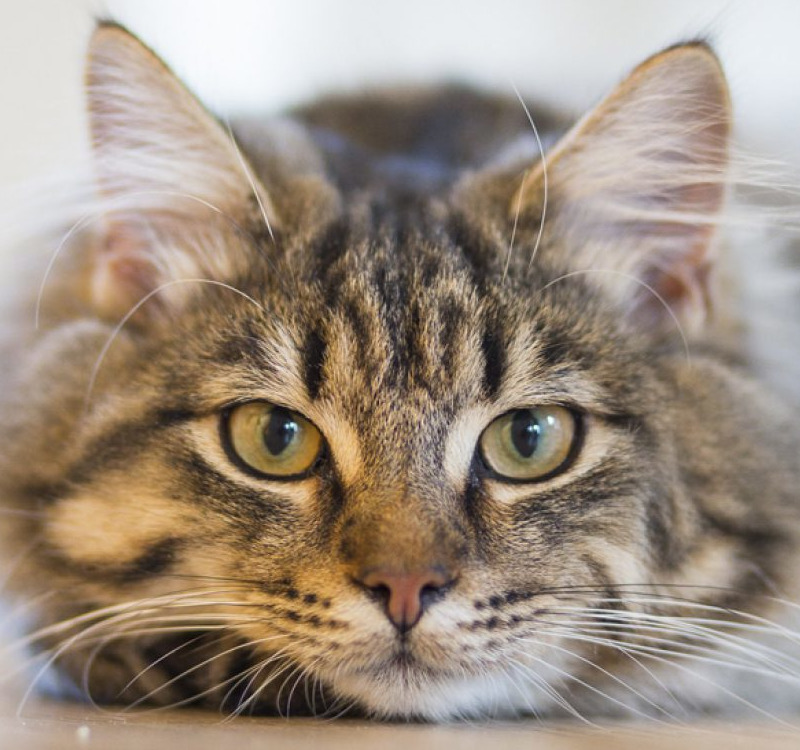
require 'rubyplot' # Import Rubyplot

img2 = Rubyplot::Image.new # Creating a new Image Object
img2.imread('rgb.png') # Reading an image
img2.imshow # Showing the Image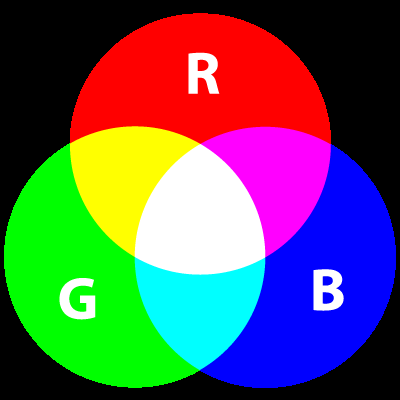
img2_pix_gbr = img2.export_pixels # Exporting pixels from img2, map is set as RGB as the image is RGB

img2_copy_gbr = Rubyplot::Image.new(img2.columns,img2.rows) # Creating an Image to copy img2 with same number of columns and rows
img2_copy_gbr.import_pixels(img2_pix_gbr, "GBR") # Importing pixels extracted from img2 in the order GBR
# Since RGB is imported in order GBR; Red becomes Green, Green Becomes Blue and Blue becomes Red
# i.e. RGB -> GBR

img2_copy_gbr.imshow # Showing the copied image
# img2_copy_gbr.imwrite("gbr.png") # Image can be written with any format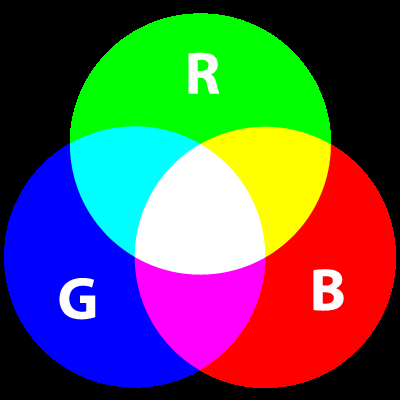
Major deliverables have been completed, and Rubyplot can now be used for various applications. XND array support, adding more plots and some minor improvements have been postponed for later. This is a very brief report, but any clarifications or any suggestions for improvement are always very welcome.
- GSoC 2018 project GRRuby by Pranav Garg can be found here
- GSoC 2018 project Ruby Matplotlib by Arafat Dad Khan can be found here
- A talk on Rubyplot by Pranav Garg in RubyConf 2018 can be found here
- Daily updates can be found here
- Proposal can be found here
- Tutorial notebook can be found here and can be viewed online(rendered) here
- Rubyplot Github Repository can be found here
- All my work can be found in these PRs: PR#45 and PR#52
- Other blogs can be found here:
- Adding Image functionality for GR backend
- Adding Image processing functionality
- Adding support for interactive plotting
- Adding support for 3D plots
I would like to thank my mentor Kenta Murata for his mentorship during the project.
I am very thankful to the Ruby Association for funding the development of this project.
I would also like to thank Sameer Deshmukh and the SciRuby community for their support and guidance.